Understanding LPPL
- LPPL (log-periodic power law) patterns emerge naturally from social networks with imitative behavior. This was popularized by Didier Sornette in his book “Why Stock Markets Crash”.
- The critical point, or climax, occurs when opinion becomes highly uniform.
- At this point, the price is very sensitive to clusters of investors changing their opinion and tops and bottoms tend to occur.
- LPPL research track record table updated May 2024
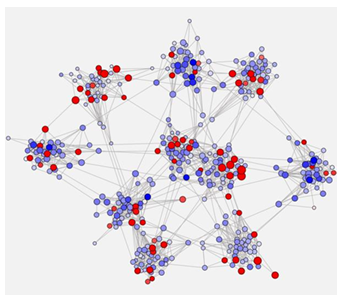
In recent years a new field of social science research has developed called social dynamics, or sociodynamics. It tries to understand how groups of people are structured (like social networks), how information spreads and how opinions change.
This research often uses models to organize people into hierarchical networks with each person represented by a node. The oldest and most common model is called the Ising model. It originated in physics to study magnetism.
In a similar vein to magnetism we can study how individuals are influenced by neighbors in their network. In social research they still refer to up/down spin as direction of opinion, as a nod to its original use case.

Didier Sornette was one of the early researchers in this area and developed the LPPL model based on this idea. His research shows that LPPL patterns emerge naturally from interactions in a hierarchical social network of traders with a tendency to imitate their neighbors. (His model specifically refers to a hierarchical diamond lattice and you can read more in his book “Why Stock Markets Crash.”)
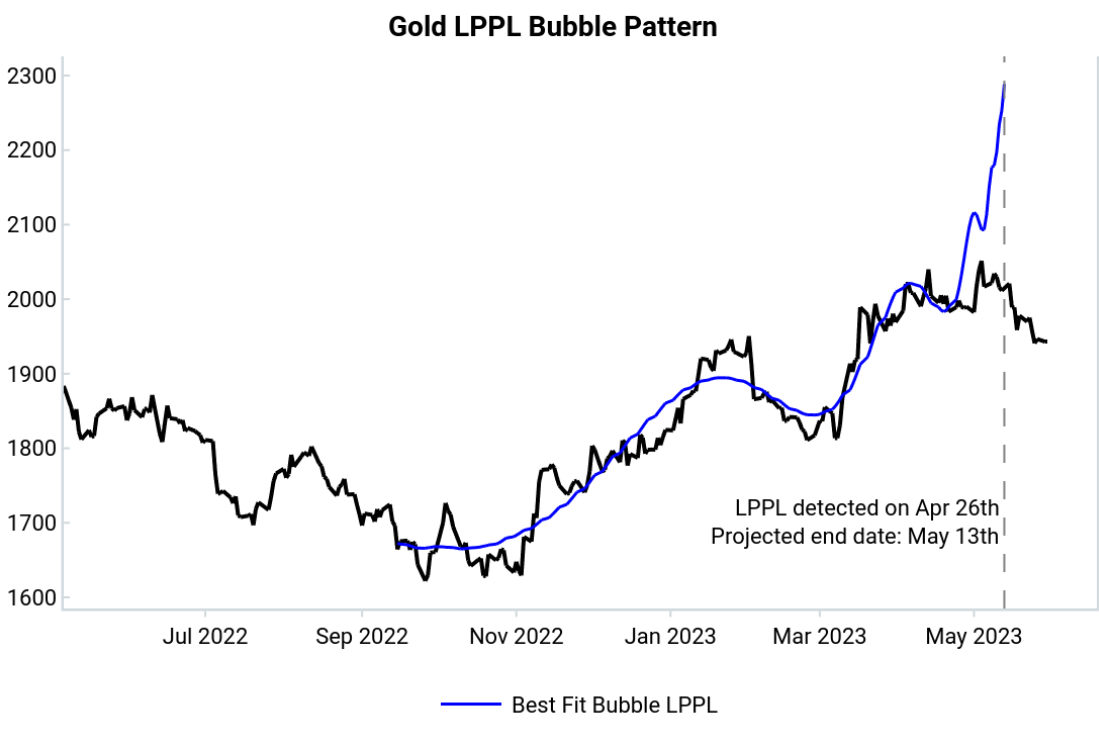
The critical point, (which we refer to as the climax or projected end date) occurs when opinion has become highly uniform. At this point the price becomes very sensitive to clusters of investors changing their opinion. The below chart on gold was a good recent example of the LPPL detection acting as a warning that the bullish trend was ending and vulnerable to a tactical sell-off.

Tops and bottoms tend to occur soon after an LPPL Climax, which marks the peak panic/euphoria moment. In practice the end of the LPPL can be more of a process than an event. Often there is a final move to the upside/downside before the turning point. Given the asymptotic behavior of the LPPL pattern, it may also overstate the magnitude of the final move.
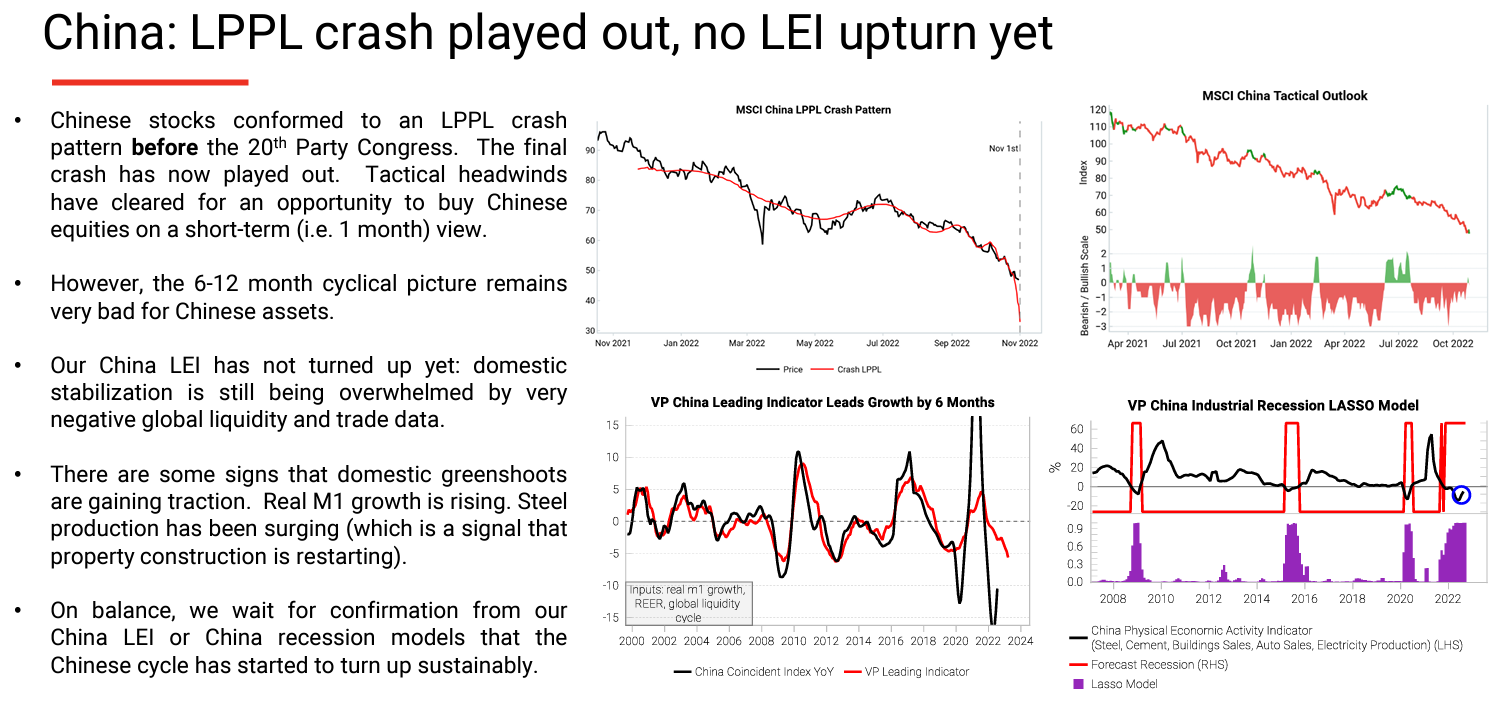
We mainly use LPPL to flag potential reversal trading opportunities. For example, on November 1st 2022, the LPPL crash passed its critical point and flagged the opportunity to go tactically long Chinese equities.

If an LPPL pattern is detected early enough, it can also be an invitation to ride the bubble or crash.
The LPPL model is not magic and it is important to be aware of its shortcomings. The model only uses price as an input, which may not pick up on significant changes in the macro or policy environment.
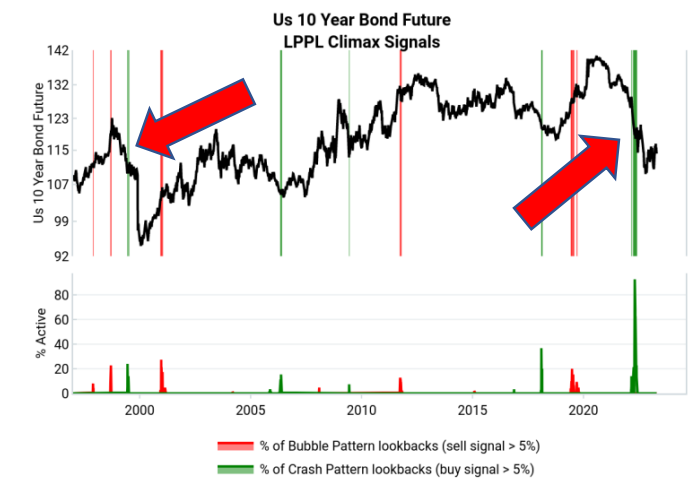
Even after reaching a critical point when opinion is already uniform, that uniform opinion can keep shifting in the direction of the previous trend. For example in summer 2022, already uniform opinion on Fed policy kept shifting hawkishly as the inflation data surprised the market consensus. The chart below highlights LPPL climax failing on 10y bonds, which caused us to be too early on adding duration in 2022.

Recent LPPL uses in the research
| Trade | Worked? | 1w fwd return | 1m fwd return | 2m fwd return | 3m fwd return |
| Short semis in February 2024 (link) | Failed | +3.6% | +7.5% | +7.3% | +12.1% |
| Buying UST bonds in Oct 2023 (link) | Worked | +2.8% | +6.0% | +16.8% | +10.2% |
| Shorting GBPAUD in Aug 2023 (Link) | Worked | +186 pips | -549 pips | -372pips | -327pips |
| Buying UST bonds in Aug 2023 (Link) | Failed | +3.3% | -1.9% | -10.7% | -2.5% |
| Tactical retracement higher in Brazil yields in Jul 2023 (Link) | Worked | -3bps | +26bps | +33bps | +63bps |
| Sell homebuilders, buy energy in Jul 2023 (Link) | Worked | -0.1% | +0.8% | +5.5% | +14.4% |
| Short Sonia vs Euribor Spread in Jun 2023 (Link) | Half/Half | +20bps | +55bps | +17bps | -4bps |
| Shorting Nikkei in Jun 2023 (Link) | Failed | +1.6% | +6.6% | +5.0% | +5.8% |
| Shorting Gold in May 2023 (Link) | Worked | +0.9% | -1.5% | -4.2% | -0.6% |
| Buying Chinese equities in Nov 2022 (Link) | Worked | +9.6% | +28.9% | +29.6% | +45.6% |
| Shorting USD in Oct 2022 (Link) | Worked | +0.5% | -4.4% | -6.0% | -8.1% |
| Buying Bonds in Jun 2022 (Link) | Half/Half | +4.1% | +4.2% | +1.3% | -10.0% |
| Shorting Bonds in Apr 2022 (Link) | Worked | +0.0% | -4.0% | -9.9% | -4.4% |
| Shorting Tech in Jan 2022 (Link) | Worked | -5.0% | -7.1% | -14.9% | -12.3% |