What's Driving the Bond Term Premium
- Term premiums help us measure the effect of macro factors on yields. Most risks (inflation, growth, demand-supply) are likely already factored into the term premium.
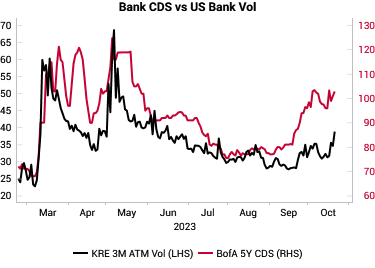
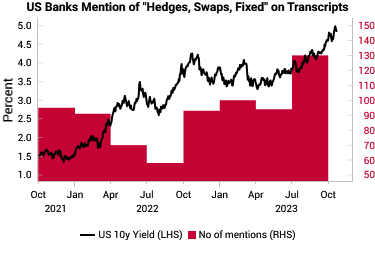
- We're concerned about underlying stress in US banks, as indicated by widening Bank CDS and increased mentions of rate hedges in 3Q23 earnings.
- 30-year bonds are conforming to another tactical LPPL crash pattern once again, currently projected to hit a climax on October 31st.
- We're bullish on US TIPS. We are in the era of political management of the economy and we believe the US government won't allow high real yields. Expect the Treasury and the Fed to collaborate on managing borrowing costs, similar to the 1942-1951 period.
“Wrong number”
As the creator of this Index, let me say that both 50 and 150 are the “wrong number” [for the MOVE index]…a level near 150 occurs when the FED has lost control… a volatility that is unsustainable if only because human beings cannot tolerate such stress for long periods of time. - Harley Bassman
Many signs of dislocation remain in the US fixed-income markets with competing narratives (inflation, treasury issuance etc.) on the drivers. We use term premiums as a framework to quantify the likely impact of the various factors on yields.
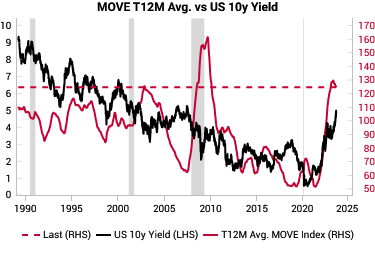
The T12M average of the MOVE index remains at very elevated levels (left chart), showing the persistent volatility in the US fixed-income markets. US 10y real yield have surged higher (right chart).
 |  |
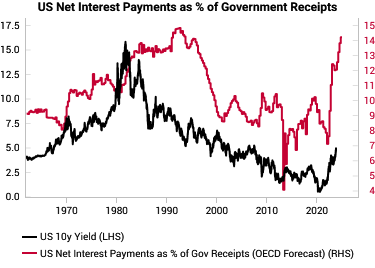
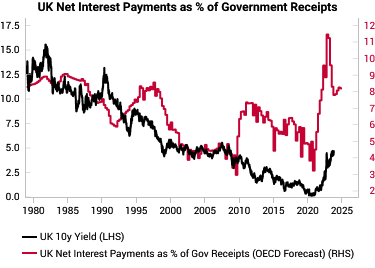
The dominant narrative has been US fiscal excess. The OECD forecast for US net interest payments as a % of government revenues has surged to 14% for 2024 (left chart), at historical highs. This is reminiscent of the UK gilt crisis in September-October 2022, when the market reacted badly to then prime minister Liz Truss's fiscal policies, necessitating the Bank of England to intervene in gilt markets.
 |  |
The term premium: why forecast a made-up number?
Bond yields can be decomposed into 2 components: a) the expected short-term interest rate over the bond's life and b) the term premium. The term premium is the “extra” yield that investors demand to incentivize them to hold longer-maturity bonds and to compensate them for uncertainty about future policy rates or inflation.
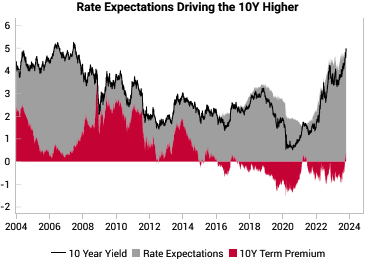
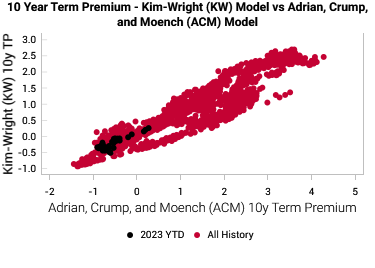
The term premium is not observed directly and is inferred from interest rate models. Some well-known models from the Fed include the Adrian, Crump & Moench (ACM) model and the Kim-Wright (KW) model. The charts below show that the different term premium models are highly correlated and that interest rate expectations have mainly driven the 2023 YTD move in yields. We generally use the ACM 10y Term Premium due to the long history.
 |  |
Even though the term premium is “theoretical”, it offers a useful framework for understanding the impact of “macro” factors on bond markets that is additive to assessing the Fed policy response function. For example, the low and negative term premiums seen after the mid-2010s show the impact of central bank policies (QE) on depressing term premiums and holding down yields, which drove a “reach-for-yield” that powered risk assets higher.
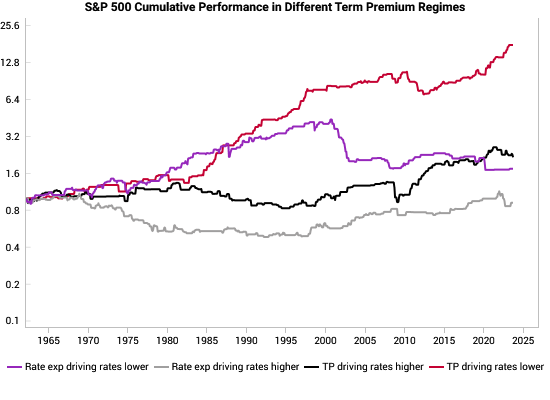
The best regimes for risk assets are when yields are falling, driven by falling term premiums (i.e. discount rate is falling, while uncertainty is also declining). In the chart below, we break down the cumulative returns of the S&P 500 into four different term premium regimes, based on if term premium or rate expectations are driving yields higher or lower. The red line shows that falling yields, driven by term premiums tend to be the best regime for equities.
Macro drivers of the term premium
There are multiple documented drivers of the term premium that can be broadly split into a few buckets:
- Inflation risks
- Growth risks
- Specific demand-supply factors
- Uncertainty about the above
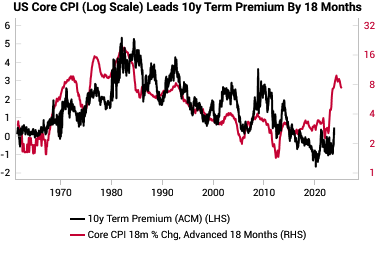
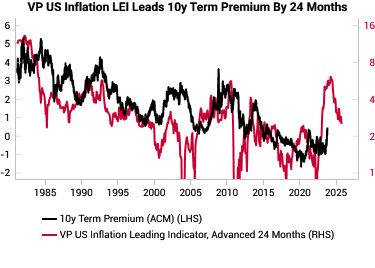
Generally, high and persistent inflation leads to higher term premiums to compensate bondholders for inflation risks. The left chart below shows that the 18m change in US core CPI leads the 10-year term premium by 18 months. The right chart shows our US inflation leading indicator, which offers an even longer 2-year lead on the term premium.
 |  |
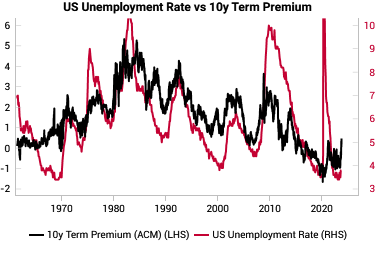
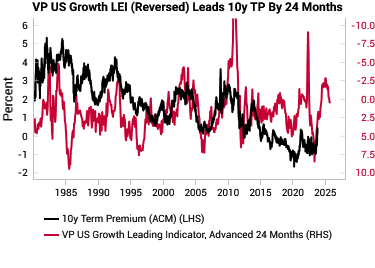
For growth risks, investors should demand more compensation (i.e. higher term premium) if downside growth risks are large. Thus we should expect a negative relationship between growth and term premiums. We see this in the relationship between the US unemployment rate and term premiums (left chart). Unemployment is a very lagging indicator, so we use our main US growth LEI (right chart), which has a 2 year lead on the term premium (once the LEI is reversed).
 |  |
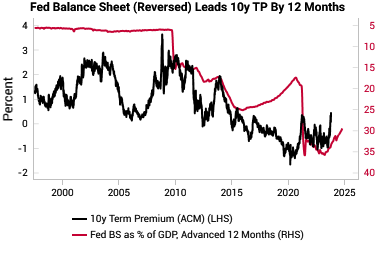
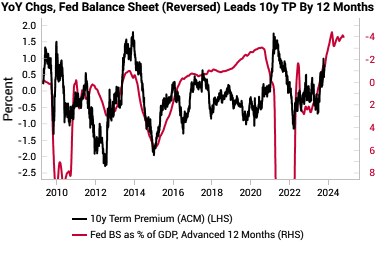
To gauge demand-supply factors, the elephant in the room has been the Fed, whose balance sheet expansion has suppressed the term premium. The charts below show the level and rate of change effects from a larger Fed balance sheet leading to lower term premiums.
 |  |
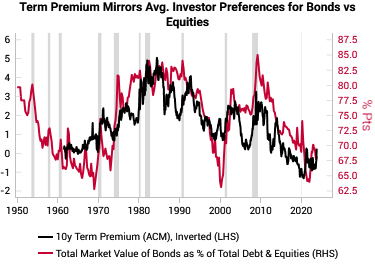
Another way to understand demand-supply from first principles is to track the relative market cap of bonds vs equities. By definition, this ratio manifests the aggregate of all investor preferences towards bonds and equities at any point in time. If the average investor decides they want more equities (for example because they think stocks are cheap or because they think bonds are expensive due to treasury supply), then they will bid up equities and sell bonds (all else the same), which drives up equity valuations.
This results in a clear long-term relationship between long-term equity valuations and the equity vs total bond & equity market caps (left chart shows the Shiller Cyclically-Adjusted Price Earnings ratio in black vs the equity share of total market cap in red). The term premium is also highly correlated to investor preferences for bonds vs equities (right chart). When more bonds are issued, it increases the market cap of bonds (all else the same), which usually requires a higher term premium for investors to absorb this extra issuance.
 |  |
The above uses the Fed Flow of Funds data, which is only released quarterly with a lag, so we can get a more real-time measure by tracking the market cap of US treasuries vs the S&P 500 market cap. Here, we can see a 12-month lead on the term premium from the relative market cap of UST vs S&P 500.
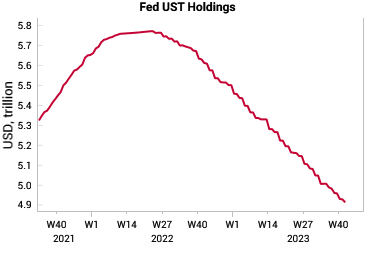
For our UST market cap measure, we net out Fed holdings to get a more accurate gauge of the UST available to the private sector. We also duration-weight our measure to give a cleaner read on the supply of “duration” to account for bill vs. bond issuance shifts. The underlying relationship still holds with raw outstanding notional amounts.
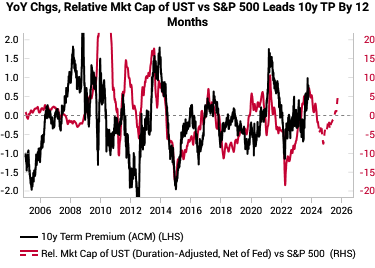 | 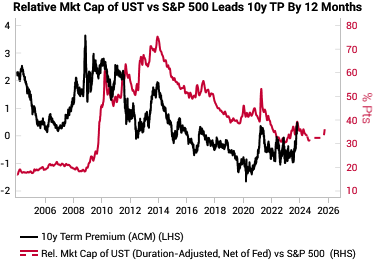 |
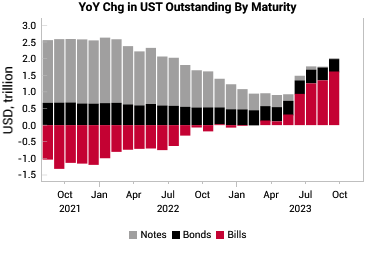
The above charts embed current assumptions about future issuance from the TBAC presentation and Fed QT to project the relative bond-equity market cap forwards, holding S&P 500 market cap constant. We assume bonds will be 20% of future issuance and notes will be 60%.
The 3Q2023 Treasury Presentation to the Treasury Borrowing Advisory Committee (TBAC) (link) shows expected issuance of around 2 trillion USD on average over 2024 and 2025.

T-Bill issuance is expected to remain around 20%:
"the Committee is comfortable running T-bills in the range of their longer-term historical share of 22.4% for some time before returning to the recommended 15-20% range, in order to maintain a regular and predictable approach to increasing coupon issuance."
 |  |
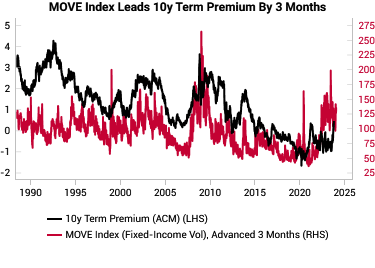
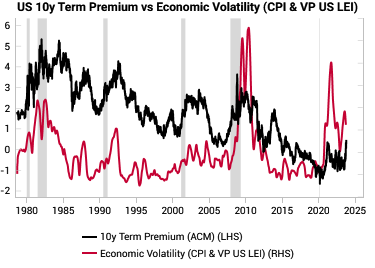
Lastly, to account for general uncertainty about all of the above, we can use the MOVE index itself. The below charts show that the term premium is positively correlated to fixed income volatility (left chart) as well as the volatility of our US leading indicators for inflation and growth (right chart).
 |  |
We take the above insights to create a multi-variate regression model of the key drivers of the term premium to come up with a “fair value” for the term premium and some coefficients to allow us to project this fair value forward.
Fair value model suggests a lot of bad news already priced in
All the key inputs are statistically significant and have the right signs, in line with the intuition built above.
| Input | Multivariate Regression Coefficient | P-value |
| MOVE Index | 0.014 | <0.001 |
| VP US Growth LEI | -0.106 | <0.001 |
| VP US Inflation LEI | 0.072 | <0.001 |
| Fed BS as % of GDP | -0.081 | <0.001 |
| Rel. Mar. Cap of UST vs S&P 500 (Duration-Adjusted, Net of Fed) | 0.021 | <0.001 |
We can visualize the fit below. Today's situation of surging term premiums above the fair value has occurred a few times in the past decade. The most dramatic of these have usually been tied to either obvious financial distress (2008/09, taper tantrum) or fiscal fears.
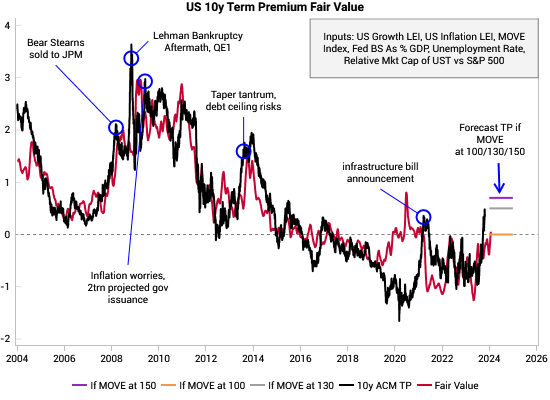
Given the various lead-lag relationships to the term premium, we can project forward what the “fair value” for the term premium should be in mid-2024, depending on where the MOVE index will be:
- If the MOVE index stays at its current level of 130 for the next year, then term premium should be 0.5%… the current level.
- If the MOVE rises to 150 for the next year, the term premium should be at 0.7%
- If the MOVE returns to a normal 100 level, the term premium should be at 0%.
This gives us some comfort that the worst has likely already been priced in for the term premium for risks to inflation, growth, demand-supply or general uncertainty.
What else is going on? US banks & hedging
As we discussed in our report Volatility Cycle Turning, we suspect some hidden stress within US banks based on the persistent widening of bank CDS during the latest yield surge. Dormant equity volatility is now starting to wake up and following CDS higher.
 |  |
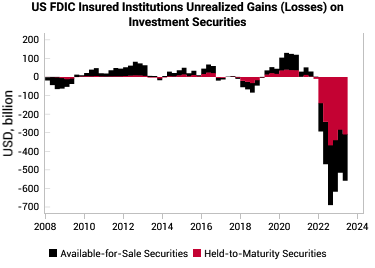
US banks are sitting on 550+ bn USD of unrealized losses as of the end of 2Q23 (left chart below). This is likely to be higher now, given the surge in yields. Mentions of hedges have also been picking up in 3Q23 earnings transcripts as yields have surged.
 |  |
The investment implications: Pascal's Wager
Given the above concerns on US banks and potential hedging needs, there could still be disorderly moves higher in yields. Still, the current moves are a sign of market dislocation (and therefore an opportunity) as the market settles down. 30-year bonds are conforming to another tactical LPPL crash pattern once again, which is currently projected to hit a climax on October 31st.
We previously highlighted an LPPL climax on August 22 (link), which did result in an immediate 20bp+ drop in 10y yields after the climax, but the relief rally was very short-lived as yields kept surging. Given our above analysis, we view these ongoing LPPL crash patterns as a good contrarian indicator.
We re-emphasize our bull case on US TIPS from June (link), which are at even more attractive entry points.
As we laid out in our Age of Scarcity thematic report, we think we are back in the era of “political management of the economy”. Investors need to make a political judgment on if the US government is willing to allow US real yields to surge in the face of planned debt issuance and spending.
Our bet is that the US government will not tolerate high real yields, and will work with the Fed (yield curve capping, analog to 1942-1951 Treasury-Fed Accord period) to manage borrowing costs in real terms.
Back in March 2020, the Fed did intervene in US treasury markets. According to the Fed minutes (link) from then:
“Participants commented on the conditions of high volatility and illiquidity characterizing the markets for U.S. Treasury securities, especially off-the-run longer-term securities, and for agency MBS…
Participants expressed concern about the disruptions to the functioning of these markets, especially in view of their status as cornerstones for the operation of the U.S. and global financial systems and for the transmission of monetary policy.”