Understanding VP Central Bank Regime Models
- Our central bank policy regime models use a combination of economic and market inputs to classify if a particular central bank is in an “easing” or “hiking” regime.
- This report updates our previous write-up with more recent case studies using our central bank regimes to help with context and timing trades around the BoC, RBA, BoE and the Fed.
- We use these regime models alongside our growth and inflation leading indicators to provide an anchor on the macro outlook. We then look for where market pricing is most divergent with this macro outlook to generate trade ideas.
Man + machine applied to central bank policy regimes
Interpreting and forecasting central bank policy can be more art than science, but there are repeatable elements of the process that can be modeled.
In our framework, there are four elements that drive central bank policy regimes:
- Growth
- Inflation
- Financial market stress
- Short-term interest rate (STIR) market pricing, which is a factor for how much central banks want to surprise markets
We can use all of the above as inputs into regime classification models to find the probability that a given central bank should be easing or hiking policy rates. We prefer using lasso regression, which is the same methodology we described in January 2023 when discussing the Fed and ECB policy functions.
Lasso regressions are a technique that identifies the most significant predictors by shrinking less important ones to zero. We think this helps to capture the dynamics of how markets price central bank policies, where in theory there is a large number of potentially important economic or market data points, but in practice only a few are significant.
The below chart ranks the 15 central banks we have modelled by the probability of being in a “hiking regime”.
As a rule of thumb, a reading of >65% is usually considered a hiking regime and a reading <35% as an easing regime. The probabilities are symmetric: a 80% probability of hiking is equivalent to a 20% probability of easing.
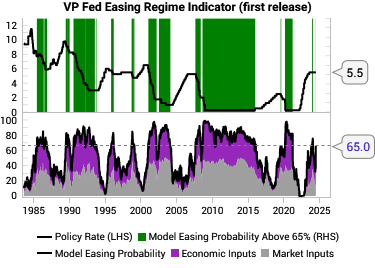
For any given central bank, we can also plot the history of the easing probability against policy rates. For example, the below image shows our Fed easing regime model. The left hand chart provides a visualization of the easing regime and probability over time. The right hand panel shows the key model inputs and how they are contributing at any given point in time.
Intuitively, the regime model output can be interpreted as answering the question:
IF the central bank response function today is the same as it has been historically, what should the central bank be doing with its policy rate today?
Thus, our central bank regime probabilities are intended to act as an anchor to interpret central bank commentary and market price action and narratives.
Trading the divergences between market pricing and the regime model
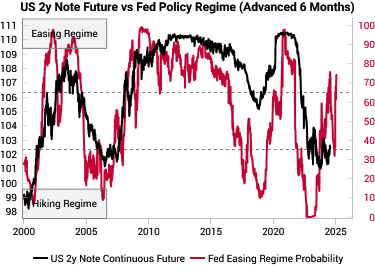
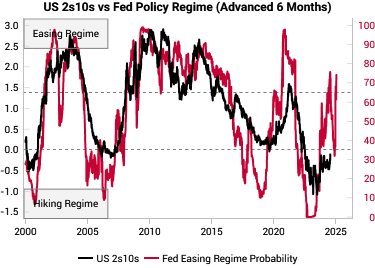
Our trade idea generation involves looking for divergences between market pricing and "what will happen" as predicted by the model. The model probabilities often offer a lead on market prices. For example, the below charts show the Fed easing probabilities leading the 2y note future and 2s10s by about 6 months.
 |  |
The below are various recent case studies of how to use the central bank regime probabilities to help with timing or context for trades.
Case Study: Bank of Canada (BoC) easing regime in October 2023 supports buying Canadian bonds
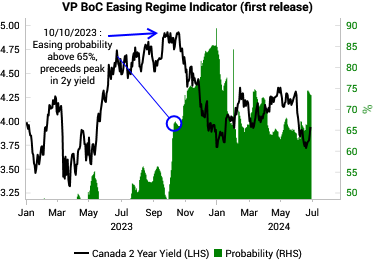
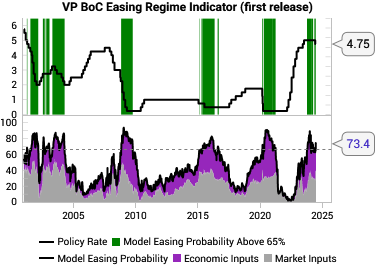
Back in October 2023, the Bank of Canada easing probability surged higher, hitting the 65% threshold on 10 October (left chart below), which was near the peak in Canadian 2y yields. This added further conviction to our long Canada 2y/5y futures trade from September 2023. Since then, the policy regime has remained stubbornly in the easing regime (right chart below) as markets became more concerned with Canadian recession risks.
 |  |
Case Study: Reserve Bank of Australia (RBA) hawkish outlier in Dec 2023 supports flatteners
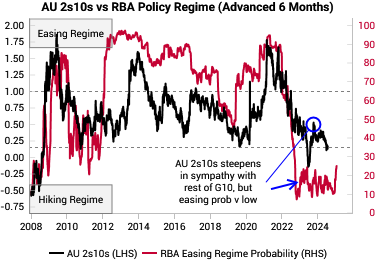
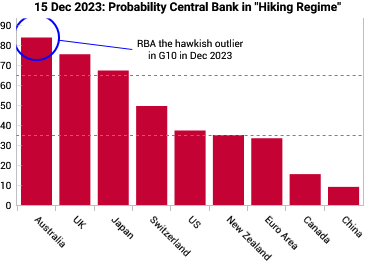
Back in December 2023, we noted the RBA as a clear hawkish outlier among G10 central banks, corroborated at the time by hawkish commentary from the RBA on inflation. We wrote: “The trade in our view would be flatteners as the Australia yield curve has been steepening recently in sympathy with other DMs… 2s10s 1y and 2y forward are already very steep.”
 |  |
Case Study: Contrarian hawkish on Bank of England (BoE) in 1H24
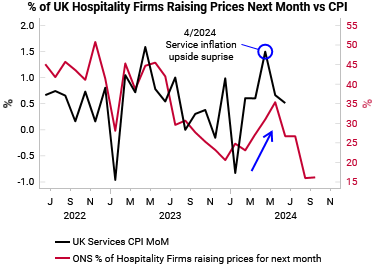
At the start of 2024, the Bank of England was still in a hawkish regime according to our models. However, SONIA futures had already discounted multiple cuts, having rallied in sympathy with SOFR futures that were pricing in 6+ Fed cuts in 2024 at the time (left chart below). This led us to to dig and find that UK services inflation lagged the ONS survey (right chart below), which showed upside risks to services inflation, which came through in the data in April.
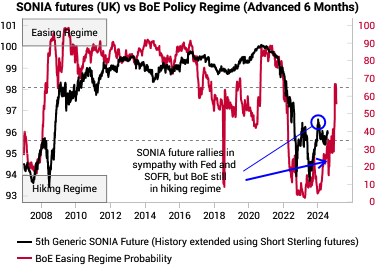 |  |
However, in this specific case, our choice of trade expression was wrong. Instead of a simple outright short on SONIA futures that would have proven profitable, we chose a spread trade of short SONIA vs SOFR to express the hawkish BoE concept, which did not work, despite our fundamental thesis working out.
Case Study: Choosing to fade Fed cuts in Jan 2024 by using the easing regime probability for context
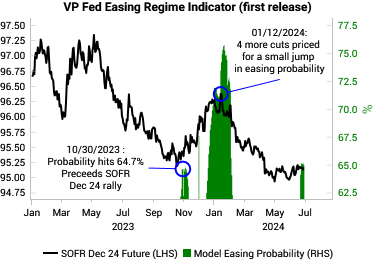
At the start of 2024, the Fed easing probability was 65%, which was "high" but given the market was already pricing 6+ Fed cuts for the year, the easing probability should really have been closer to 100%.
Instead, we saw that from November to January, the market priced in 4 extra cuts for 2024 with only a small 10% rise in the model easing probabilities, which suggested markets were over-reacting to the chances of Fed easing. This led us to a short SOFR trade in January betting yields would rise.
 |  |