VP January 2024 Market Outlook & Discussion
- 3 key trades:
- Short SOFR
- Long USD
- Long oil / energy
- Learnings from LEIs in 2023
- Equity valuation divergences
- Tactical: Hong Kong squeeze signal
- RV: banks vs insurers, RBA out of sync
Scott: [00:00:00] Okay, well hello again. Welcome to Variant Perceptions. First client call of 2024. As usual, I'm joined by Tian. Our goal for the call is to cover what's top of mind for us, as well as big month-over-month changes across markets. If you have any questions during the call, as always, you can use the Q&A feature in Zoom to submit those questions. So, a little bit of framework: at the start of 2023, if one was to say that the Fed would hike another 100 basis points to 5.5%, China reopening would be a dud, and the Eurozone would slip into a recession, it would seem very strange for the S&P to end the year near all-time highs. With the benefit of hindsight, fiscal stimulus, labor hoarding, still high levels of liquidity compared to negative rates of change, bearish positioning, and the AI narrative all helped to create said outcome. If you look now at a year to date, the S&P has turned positive after an initial sell-off. Although it's trading down a little bit today, the ten-year is back near 4%.
Scott: [00:00:57] The dollar and oil are positive, while gold has had a bit of a sell-off. We've seen a variety of Fed officials saying that the Fed will cut rates as inflation falls in an effort to keep the same level of restriction. We just had CPI today, headline at 0.3% month over month, 3.4% year over year, both above prior readings and expectations. Core was in line month over month at 3.3%, down slightly year on year to 3.9%, but came in above expectations. Inflation appears to be the biggest risk to the soft landing / Fed cut narrative, given potentially the sheer size and magnitude of fiscal deficits, even though the impulse is starting to fade a bit. So with that framework, Tian, we asked ourselves three key cyclical questions as part of our 2024 themes, given our learnings from the year prior and where our leading indicators are tracking now. What is your take on the macro backdrop? And maybe you can walk through some trade ideas based on your takes.
Tian: [00:01:50] Well, hello, everyone. Happy New Year. I think we've labeled this presentation three key trades. The biggest learning from 2023 was that clearly, for the US growth side in terms of the labor market resilience and consumer leading indicators, we did not do a good job. The question was whether it was too early or too late. But at the same time, leading indicators did work for a lot of other things we track, like US inflation, Europe, China. So one of the learnings was that for some of our key trades this year, we should try and prioritize areas of the market where they did behave according to these indicators, where that traditional approach we have of looking for the biggest divergences between market pricing and the indicators and then trying to structure trades around it, should still most likely work. Jonathan Teper, who founded VP, always talked about this idea: a good craftsman never blames his tools. He builds better tools. As a result, we've put out some big thematic reports last year on Godot’s recession, this idea of tracking labor holding, and then the Hierarchy of Money.
Tian: [00:03:13] Right. And I think those are going to still be very key concepts going forward. So, at a very high level, that's where they are now. Specifically, though, in terms of the market and these three plays, I actually think it's quite nice as a combination because we basically have various elements of cyclical and tactical lining up on these that suggest that on its own merit, it is reasonable timing, but collectively they cover you for different scenarios. So that's kind of where we're coming into this with. I still think ultimately the story of the year is probably downside risk to US growth and upside risk to the rest of the world. But it's just a case of degree, right. And obviously, we've seen the market be so aggressive in pricing Fed cuts. I think this is kind of our starting point in how we're trying to structure the portfolio. So just going to the Fed, ultimately the kind of short-term interest rate futures markets, you only get one price to price a range of outcomes. And clearly at critical moments like this, ultimately the market price has to be like an average of two pretty binary outcomes in my mind. Either we do get the genuine soft landing. The Fed sticks it. They do the gentle cut three times this year as they kind of implied. Or they overdid it. Something breaks, hard landing. In which case it's going to be a lot more than six cuts. And I think that's the tension in terms of, yes, the market is pricing 5 to 6, but we're actually trying to price these two binary outcomes. And so it's a question of which way is it going to break. And I think that's more why I think right now betting on slightly fewer cuts is pretty interesting. Just on the right-hand chart here, what we've shown is that in the event that there's obviously a hard landing, by definition, as I described, because the market has to price a range, the number of realized cuts in the end will be a lot greater than that price. Right? So there's always that risk that if you get the hard landing, it's going to go a lot further. So that's just a feature of the situation. But obviously as of right now, we can see that, let's call it, obviously depends on exactly how you want to measure it. We're using the SOFR three-month futures where there's some basis and things to consider, but roughly let's call it like 150 plus or minus some amount.
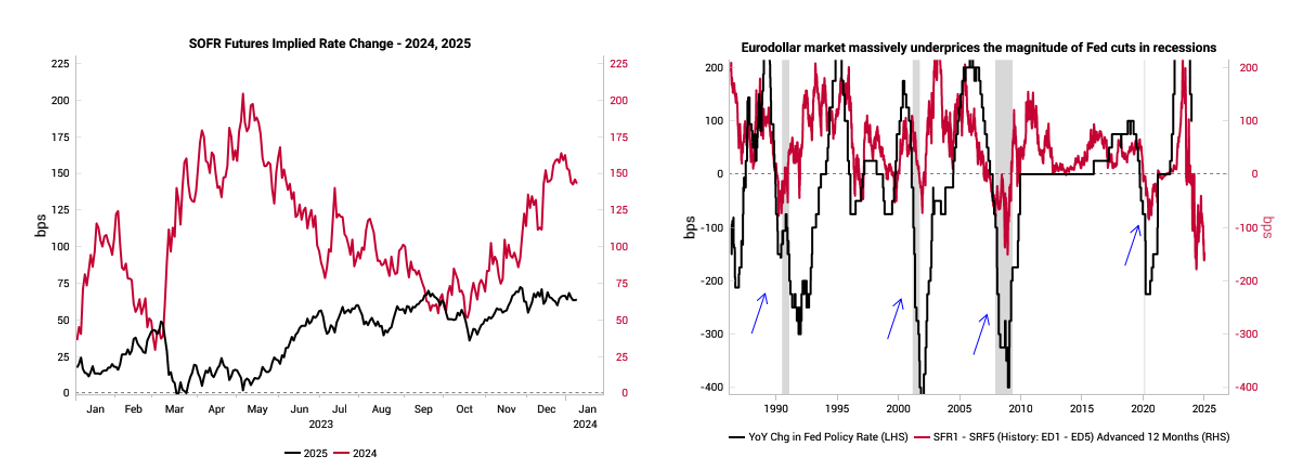
Tian: [00:05:39] Right. That is going to be priced in with a lot less in 25. Now what's really interesting is yes, our Fed easing regime models like the lasso regime models did flip to easing. So timing-wise the Fed should be cutting. That's kind of confirmed. But it's just the magnitude of what's priced in. So on the right-hand chart here, what we've done is we've just kept our US neutral rate estimate model going. But just preserve the kind of pre-Covid coefficients on the model. And obviously, you can see the distortions to the model during Covid. Obviously, the Fed discontinued this. And then there was a lot of volatility out of Covid. And since then though there's been this very interesting gap opening up. Now obviously there are different ways people talk about in terms of nominal GDP, right, or Taylor rule and things like that. But it seems not unreasonable that for our model, the real neutral rate estimates around 178. Right. Just obviously plus or minus. And if the Fed themselves tells you they think we end the year even on core PCE with inflation, you know, anywhere from 2.3, 2.5, 2.7, right. Depending on what they ultimately revise up and down. Let's call it 4%. Right. So if that's the case we're pretty much saying okay the market's already fully discounted that the Fed's going to take it back to there.
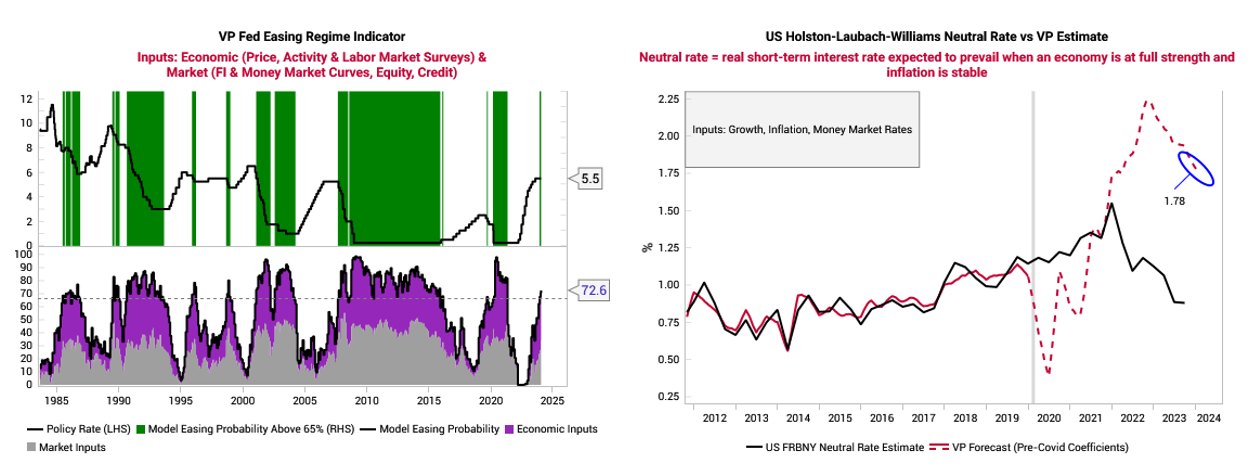
Tian: [00:07:01] That's kind of the market base case. And it kind of feels like from there the risk might actually be to the upside unless we immediately get like a hard landing kind of really starting to kick in. So that's a little bit how I'm trying to think about, okay, what is a reasonable amount of price in how much more room that is? So I do think like obviously what we've pitched is shorting the Dec 24 SOFR futures outright. And then I think it's possible to the spreads, but it might be being too cute. So I think that's kind of my starting point where it kind of feels like we've have a lot of cuts pricing in. And most likely the only way that happens is we would need to get the immaculate disinflationary soft landing. Now obviously our Leading Indicator Watch talked about US inflation. Leading UK is starting to bottom. They're not going up but they're kind of leveling out right. And at the same time, there are inklings of this disinflation narrative being somewhat consensus. The left-hand chart here shows the actual raw inputs into all our various country inflation leading indicators. Right. So this is like roughly 100 different inputs. And we can do a diffusion of the quarter on quarter change or the year on year change, right, depending on which version we use.
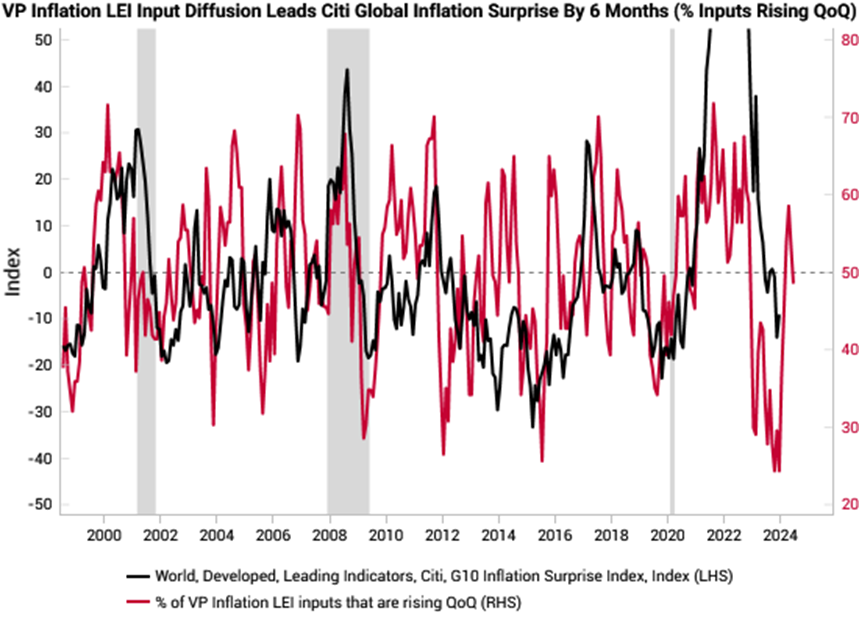
Tian: [00:08:18] But basically this gives you a sense that yeah, you're back to a more normal regime, but it's not fully disinflation anymore. Right. Which would kind of be the necessary condition to really prove out correct. On the SOFR trade. And equally, this labor hoarding idea that we laid out in our recession report in June, I still think it's pretty valid. As we can see on the right-hand chart here, there's still a big gap between hiring intentions and actual kind of earnings prospects. Or actual realized earnings. So again, normally we show a kind of a bit more smooth, but basically the raw data, you can still get a sense of historically earnings and hiring intuitively have to be correlated. So the red and the black line is obviously moving together. And then it's pretty clear after Covid is kind of this meaningful break where the red line showing hiring intentions is kind of consistently higher than the actual earnings changes. And that gap is just a sign of labor hoarding.
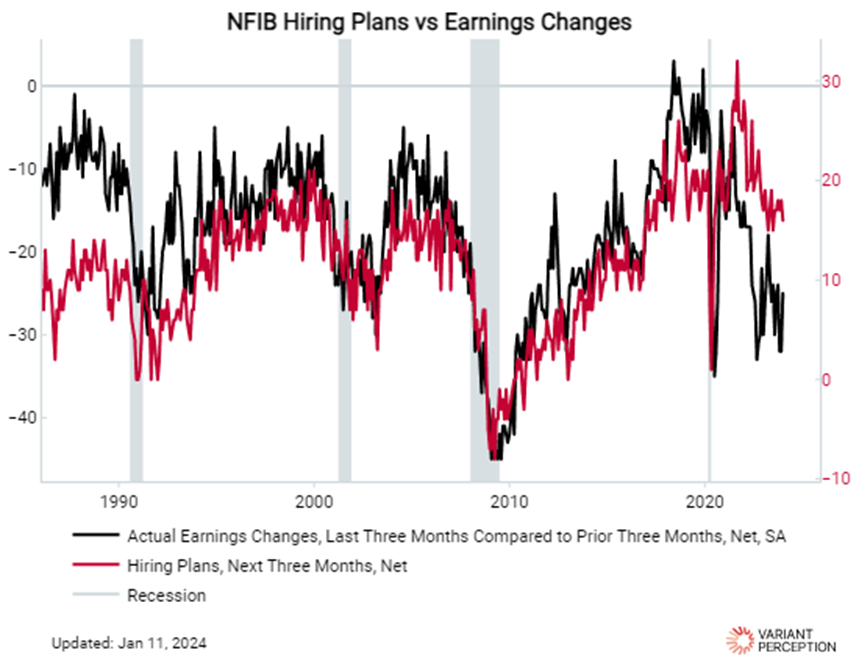
Tian: [00:09:26] And obviously, in our view, the sign of labor holding is not necessarily a sign that businesses are super optimistic on the future. It's just a sign that there are issues with the quality of labor, cost of labor, so forth. And obviously that is, again, something that means the labor market is not going to just break like usual. Like it's going to be a lot more of a slow burn. And you know, companies are not going to be preemptively laying off any workers. They're going to have to be forced into it. So it's only in a hard landing scenario. Companies actually fire workers. Otherwise, they won't. And that it'll be other. It'll be profit margins. It'll be other aspects. That probably takes the kind of initial adjustment. So again, this kind of suggests the labor market is a lot less likely to have the kind of obviously, we'll need to just keep following initial claims and so forth to see if it breaks. But again, if the labor market resilience is a feature, then again, you're more likely given we priced so many cuts in that it might come out so. I feel like that that that's an interesting divergence versus our kind of inflation leading indicators. And obviously inflation indicators did actually work last year. Now the second way to express the trade, which lines up really nicely with our tactical models, is actually to go long dollar.
Tian: [00:10:42] And obviously this is again pretty contrarian at this point. But the left-hand chart here shows basically a diffusion count of all the kind of individual FX pairs, signals right against the dollar. So we can see this, this green bar spike here, coming to the beginning of the year.
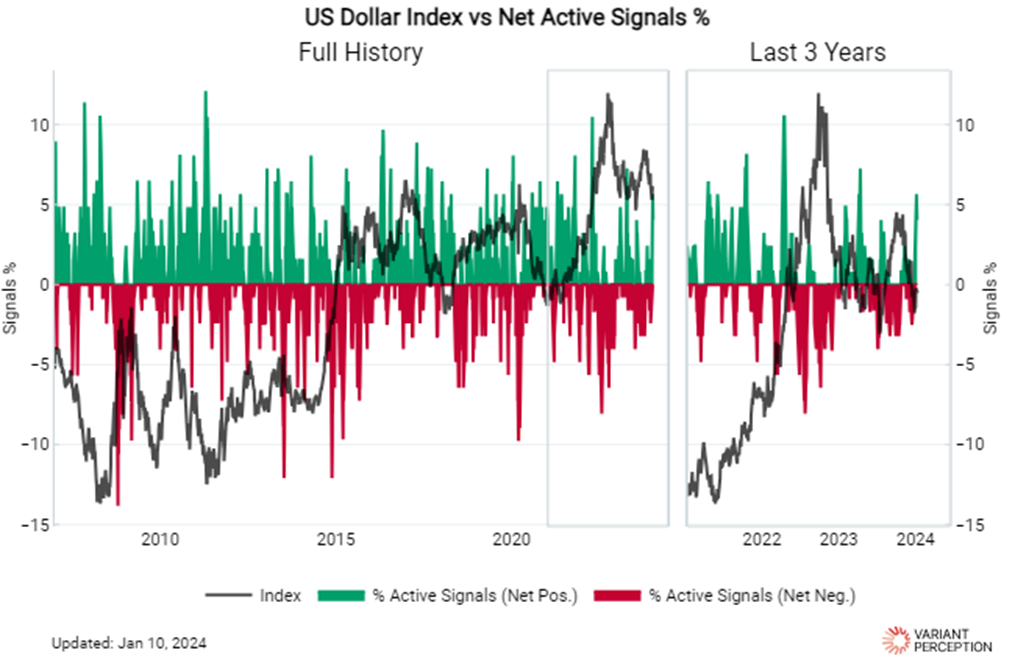
And obviously a lot of analog finders are now also starting to confirm that the dollar is probably in some kind of bottoming process after the adjustment.
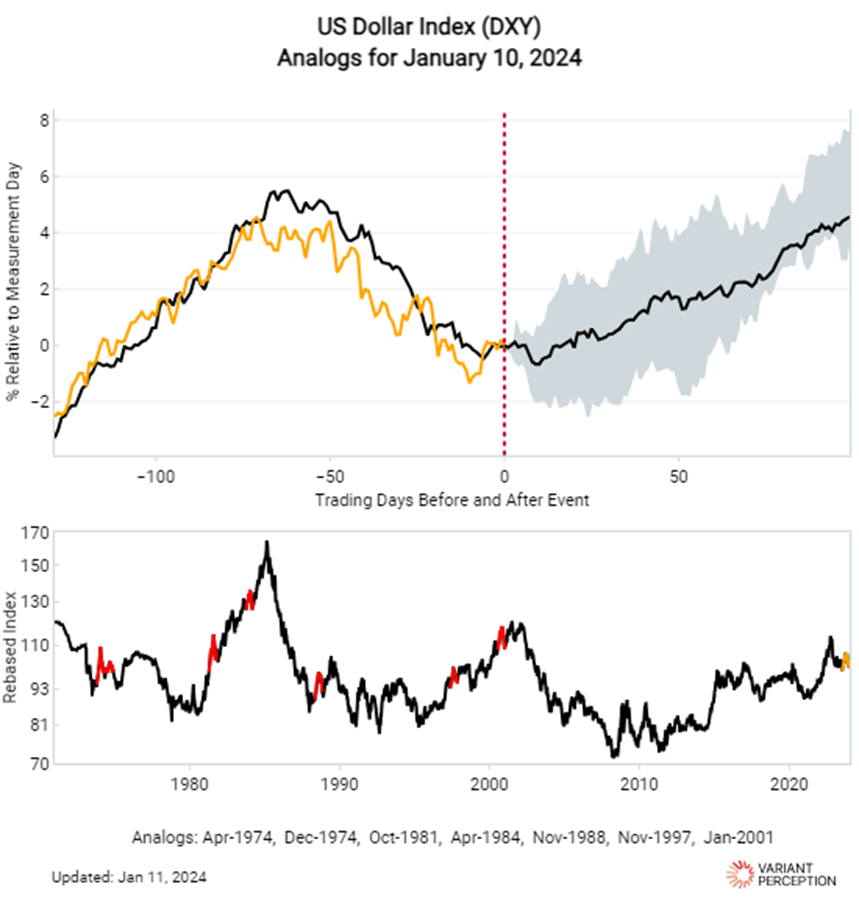
So I think this is pretty interesting. At the same time as this is obviously ultimately aligned with our kind of 12 months forward outlook. You know, we wrote this report last year on how to combine a lot of macro fundamental variables to think about effects. And we were using basic gradient boosting to train the models to give us a bit more understanding of non-linear relationships. One of the toughest things in FX markets is we've gone from just carry and policy, to the big role fiscal is playing because of the shifts in policy. You know, we kind of need to embed everything. So you can see the models capturing kind of carry but also capital cycle and the current account and fiscal deficits.
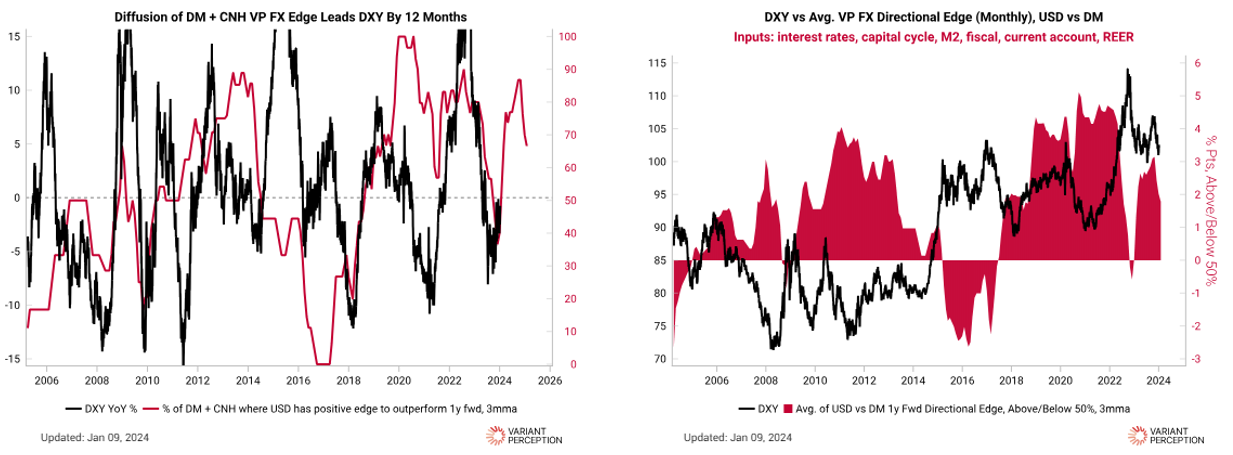
Tian: [00:11:56] There are elements of kind of Mundell-Fleming models and so forth. So the net outcome of all of the work is that actually we think there's actually some edge on the 12-month forward basis to be long dollar. So if we have a tactical model and this kind of model are saying long dollar, then it becomes interesting to be like, okay, does that line up with our kind of the macro thesis? And clearly we had the dollar selloff, which was linked to pricing out a bunch of Fed hikes or pricing in a bunch of Fed cuts. So I think that's where it's interesting, where if we price fewer cuts out, then the dollar probably has a chance to actually recover. And traditionally the dollar has this dollar smile. Again. This is Steven Jen's framework from when he was at Morgan Stanley, where the dollar generally should do better in either hard landing or if the US economy outperforms but the dollar is weak in the event the rest of the world outperforms. And that's obviously the key risk. But also positioning wise, the left-hand chart here shows kind of the futures positioning on the dollar. But the way we do it is we weight the open interest. We weight the kind of futures based on the amount of open interest.

Tian: [00:13:03] The dollar value of open interest provides a more realistic weighting on what it looks like. We can include gold and silver in this analysis. The basic takeaway is that people are short on the dollar in aggregate. Against the dollar, strictly speaking, it is a bit more neutral. But overall, that's because of the long position on gold that's implied as well. So it feels like positioning is not too egregious. Given this dollar smile framework, if the rest of the world outperforms, which is starting to maybe come through, then the dollar weakness carries on. The Fed might end up doing some cuts. So you don't actually make a huge amount on your SOFR trade. But this is where I think the last leg is to be long energy and long oil.
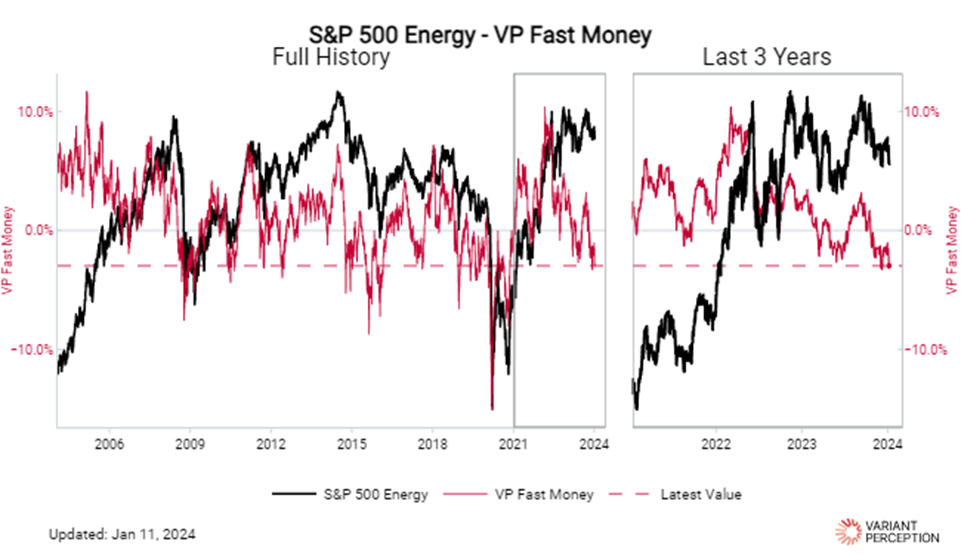
A similar expression would be some kind of long beta kind of equity, like long small caps, basically long-term beta that's linked to the rest of the world that's priced in recession. We mentioned industrial commodities, small caps, obviously EM, China. There are a lot of things that underperformed last year that have more chance to come back. But in particular, energy is interesting because of the timing. Our energy fast money has dropped to a level. It can go lower, but this is starting to go towards quite contrarian levels. We've actually taken out the support level on this trailing one-year VWAP. We build these bottom-up. I really like these VWAP concepts when it comes to confirming a bunch of our indicators. As a reminder, what we're doing is taking all the equity indices, taking the underlying stocks, and working out what their trailing one-year, three-year VWAP are and using those values to build back up to the index. So by definition, this value should be where all the investors in the space are long or short. And these levels end up being pretty meaningful support resistance because this is where on average the P&L is going to swing from positive to negative for the market. This is why I think this is pretty important. We'll see if this actually breaks or if we're able to reassert. In an ideal world, we see this fast money bottom out, this start to reassert itself, and then we basically recover.
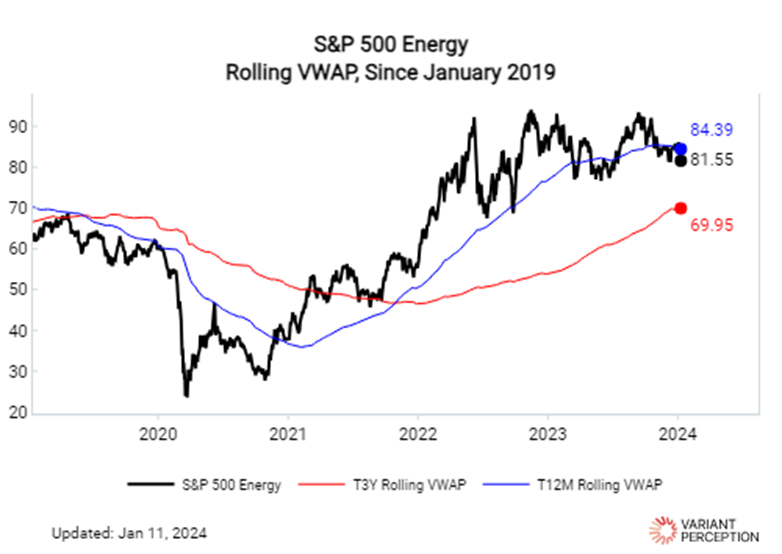
Tian: [00:15:36] And that'll be a pretty strong sign that the long energy trade is going to work. On the macro front, the big story last year was obviously oil underperforming. As we discussed, China, Europe, and the release of the strategic petroleum reserves by Biden played a role. But the way that oil has been trading is very consistent with a typical low inflation recession, like a standard hard landing. So given this is already priced in, there's probably upside if we don't realize that. If we exclude the SPR reserves, inventories are near the lower end in the US according to the EIA data. That's another potential for upside surprise. The biggest thing is the fact that the US has to rebuild its strategic petroleum reserves. We've seen that on the left-hand chart. It's slowly starting to pick up. So when the price comes off, there are more reasons to think that these things are a lot more flawed. If we break down when WTI goes towards below 70, it's more likely that they step in.
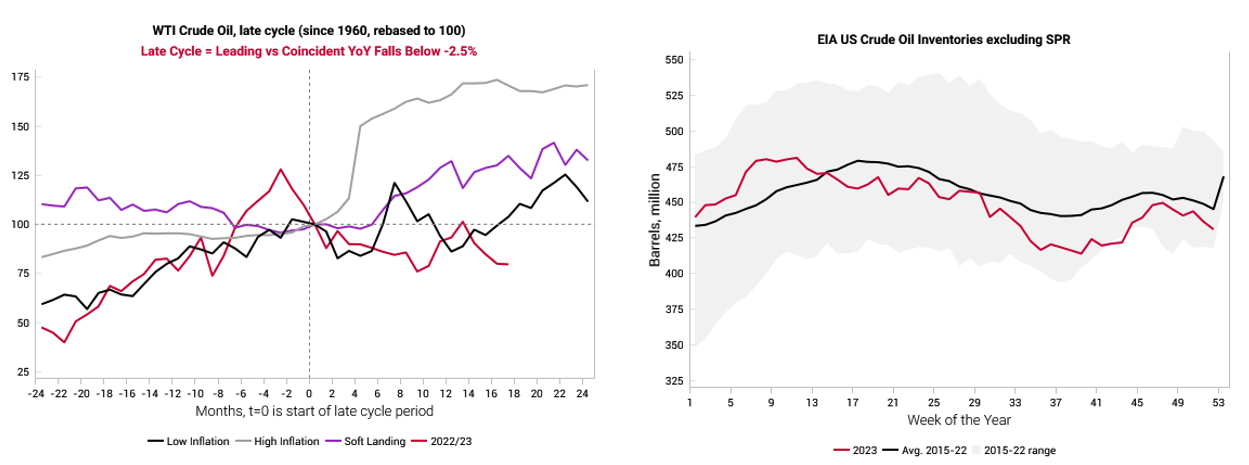
Tian: [00:16:48] At the same time, the producers are not laying the foundation to go bonanza. Rig count has been coming off a little bit, drilling computer wells. That's the big thing that's come right off. So it feels like a lot of things are aligned here that again, in isolation, long energy and oil is pretty cute. Long dollar is cute, and fading the six 5 to 6 cuts depending on what they were looking at. Those are quite cute. But if you put it together, it's quite a nice kind of pair, given where we see leading cases. In the event that you just have more margin of safety effective in each piece, so that when you put it together, there's a chance to make money. Now, I get that the package overall is actually slightly risk-on because it's only on the dollar hard landing leg that it's risk-off. But just for Q1 in terms of what we can see today, unless initial claims break, this seems like a much cleaner kind of divergence in terms of how we want to be positioned.
Tian: [00:18:01] That's in terms of three key trades, but just like other tactical trades, that might not be fully as aligned in all our time horizons, but I still think are worth flagging. So one is our short squeeze signal on Hong Kong.
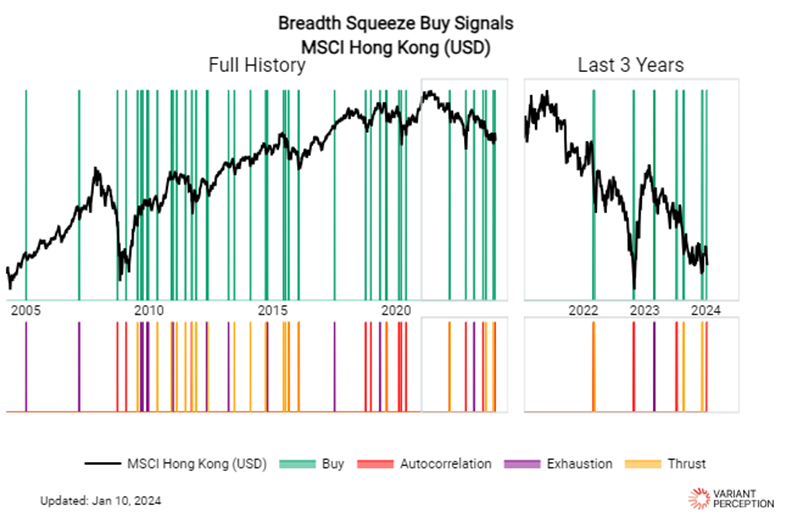
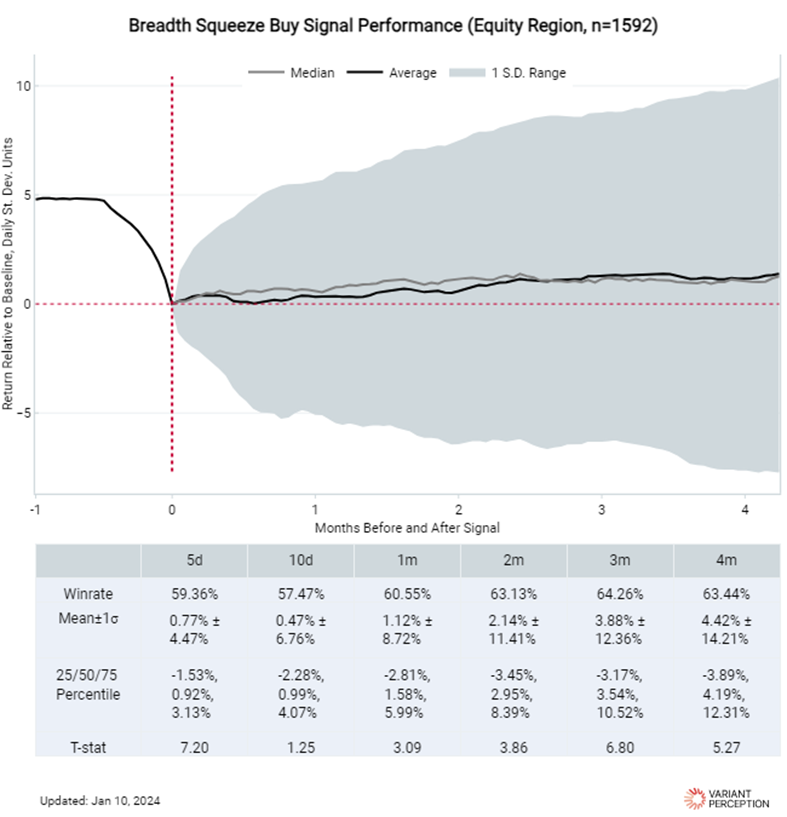
The main reason to flag it is that this is one of the strongest back tests of any trading signal we have. We've shown it here with a very high win rate, actually meaningful statistical significance. We wrote a white paper on this, looking for extremes in selling exhaustion. So right now, we're getting these things triggering on Hong Kong.
Obviously, 2023 was a story of very short half-lives on these things. China-linked Hong Kong has just been like massive structural headwinds. And each time there's a squeeze, it's very fast and doesn't last that long. Clearly, I'm aware that that's been one of the major issues with this trade. So to structure it correctly, it's a case of doing it via more cap downside, looking at call options, call spreads, and these kinds of ideas.
Tian: [00:19:18] On the Hang Seng, you can get some pretty good 10 to 1, 20 to 1, depending on how it expires. So I think those are trades that could potentially be quite interesting for clients. But so again, just using that VWAP concept. Just knowing that the anchor in terms of where the big overhead resistance has been has just been this trading one year. Everybody's underwater. It's really hard for these things to break through on the squeeze. So looking at doing options that ultimately have this in mind is very interesting. So like if buying an 18,000 strike call say to like February-March. And then on the off chance it really works, you'd be taking profit as it gets closer to 18,900.
Tian: [00:20:19] Or equally, if you buy an 18,000 call, you can then look to sell like 20,000. You can do one by twos, but they might not pay off as quickly. But if you get the grind higher in that, let's say we get some positive news on China. But it's not an instant V kind of rally. But it's one of those things where, yes, then we truly run out of sellers and just grinds higher through Q1 and onwards, then that scenario probably pays off. But I think this is just again, this probably you have to given we've talked a lot about China before where a lot of the problems are features and not bugs. Now in China, we talked about just the animal spirits. It probably will take a lot for the actual fundamental story in China to shift. And obviously, there's not a lot of signs of that right now. But I think just from a trade and just out of being rational and focus on some of our tactical backtests. I think this is actually really cute as well.
Tian: [00:21:17] Just conscious of time. Do you want to talk about this? I'm not going to get back to the central bank trades.
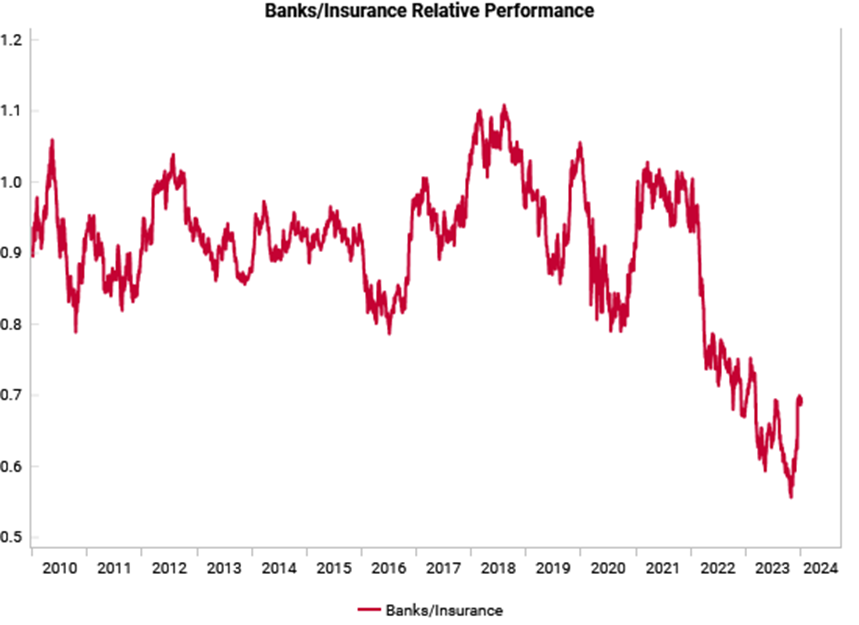
Scott: [00:21:22] Yeah, absolutely. It's interesting, such a divergent macro backdrop. John Maynard Keynes' famous quote, "Investors can stay irrational longer than you can stay solvent," which is why we often coin the concept of you have to play the game on the tactical standpoint, on top of our cyclical and structural frameworks. And yeah, so one of those under the surface divergence trades that I noticed was you look at, in 4Q, big laggard rally, whether it be small caps, a variety of sectors versus the S&P. But then you have divergences like this, like banks versus insurers. Banks did rally aggressively against insurers, like 25% in the fourth quarter. But since 2021 are still down, way outside of retracement levels to 2021, still down 25% relative to insurance. Valuation spreads are extreme. Price to tangible book value is at the 98th percentile. The spread between insurance and banks. I think there's a bit of an issue with accumulated other comprehensive income hitting tangible book value, which is affecting in the spread. But thought it was worth pointing out where that spread's at today. But it is one of those trades that in either rate cut scenario could probably do alright, helping bank profitability, but I think it just is a good flag of there's so much divergence under the surface across sectors.
I don't know if you can pull up on the portal link to how small caps like you mentioned are pricing way towards recession where the S&P is not. There's just a ton of opportunities like that. And that's in this kind of environment.
Scott: [00:22:59] Putting the focus on maybe a little more leaning towards the tactical playing in the game framework, to capitalize on said divergences. If you look at where small caps are priced versus large caps, a lot of recession is priced in there versus large caps within sectors.
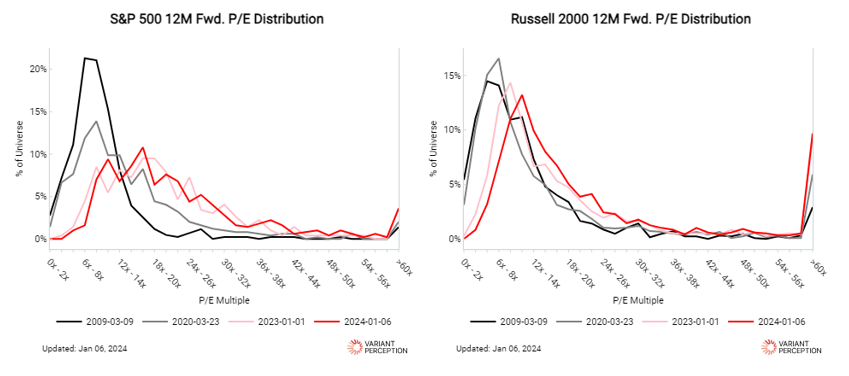
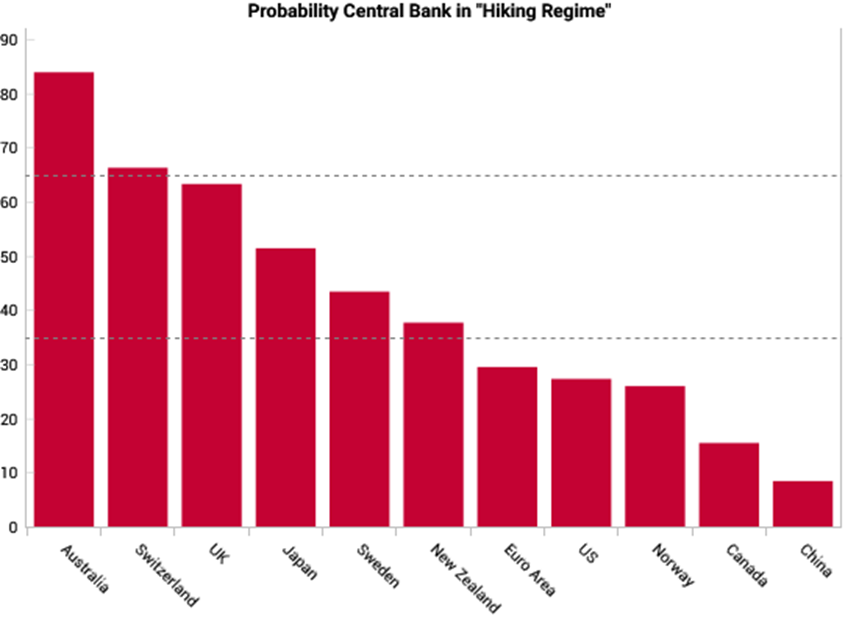
Tian: [00:23:18] I think there's a sense of, again, we'll record What We Got Right and Wrong in a bit. But if we actually look at the rest of the G10, a lot of the things actually work pretty well in terms of a lot of the fixed income and FX stuff. And actually for single names, even in the US, the factors did a good job extracting a lot of performance in long homebuilders and stuff. But clearly, some of our regime stuff missed the fiscal right. And the fact that the labor market did not deteriorate. So I think, linked to that is this idea a lot of the equity factors actually still behaved reasonably. So again, there's an element of yes, there's reasons to be concerned about growth downside, but there's a lot of bad news discounted into non-large US large cap names. So there's certainly an argument for going in and then you know, I think that's been more our stance in the second half. Being more selective in terms of picking up all the single names you like and then potentially just trying to run hedges and just understand you're going to have to pay a little bit of premium. That might be the other way to frame it because you can see the distribution is starting to shift out a little bit, but it's still pretty extreme. The other thing that's really interesting is this big divergence in central bank regimes. So obviously we had the Fed one earlier, but this is just ranking the main G10. And we show China as well where Australia is like way an outlier against everyone else, like most countries are priced into an easing regime. And Australia, I think we've been writing about this since Q4, where a lot of the leading indicators are genuinely consistent with a soft landing scenario. So it feels like this is a really interesting off the beaten path idea. I mean, our initial take was just to do flatteners in Australia. But I think once some of the tactical aligns in terms of the Aussie dollar, I think that'll be pretty cute. You see some weird pair trades where New Zealand's a lot lower in terms of probability than Australia. So like Aussie Kiwi. And these are pairs where it could be a beneficiary. But I think with just the tactical isn't quite aligned yet. So I think that these are some again they're not core big directional trades more probably looking at more specific RV type situation. But it is pretty interesting to note that this big gap here. So I think that's probably the most interesting non-big asset class view.
Scott: [00:26:00] Definitely. Well, we're coming up on the half hour. Tian, we ran through a variety of trade concepts, our macro framework, our learnings from last year, going into this year. Anything else you want to hit on before we wind it down?
Tian: [00:26:17] Yeah, I guess this has been quite a trading-focused call, I guess in terms of from the allocator or like a longer time horizon allocation point of view, I think, again, that not a lot has changed from our themes. We like TIPS. We talked about some of the MBS spreads and these things. Those still make sense. Otherwise, I think we need to let the market play out a little bit, react to some of the data surprises. In terms of curve trade. Like a lot is embedded already in terms of the forwards in terms of twos tens and things like that. And then on equities, again, I think it feels more like there are reasons to be worried about the US. But actually if you look at the rest of the world, starting to allocate towards those areas become really interesting because of China and this was actually in the leading indicators as well. Where we showed these economic surprise divergences, some of the shifts in terms of Europe leading Nikkei in particular, starting to bottom and having an uptick where it kind of feels like we might be into one of the first times where the China Europe cycle might actually be out of sync with the US. Traditionally, the US should always lead, right? Like all the decoupling generally is bogus and US drives everything. But because of how unique 2022 was, 2023 was, when China, Europe have kind of gone through those recessions already and gone for a more standard leading to coincident cycle, whereas the US obviously had a lot of these offsetting factors basically linked to fiscal. Households continue to spend that might have actually desynced it. So you could end up with a Europe, China that actually does well, even if the US really slows down. Like it's actually not unthinkable this time. And so that could be something that ultimately support some of the equity allocations where again, this is just being a divergence in what's priced in. So I think that's that's pretty interesting in terms of like EMs and those areas. So I think within equities, I think those are probably a lot more where we want to be, leaning towards the rest of the world versus the US.
Scott: [00:28:38] Yeah. And it'll be interesting to see how the earnings picture plays out. I know we have a couple big bank earnings calls coming tomorrow. Just given where estimates are versus guidance, job openings, higher rates, it will be a key theme to track through the quarter. And speaking of MBS, I know that's still one of our highest conviction trades. And I'm excited for to hear you catch up again with Harley Bassman tonight on the Simplify podcast, diving into that theme a little bit more.