Understanding VP Analog
- VP Analogs use Dynamic Time Warping to find "base case" forward return expectations for asset prices based on the past
- The underlying assumption that the future echoes the past doesn't always hold, so this indicator needs to be used with a contextual understanding of the macro regime
- VP Analogs flag both trend-continuation and/or mean-reversion patterns, resulting in an indicator with low correlation to price and other traditional technical analysis indicators
Analog in Theory
“The present is the past rolled up for action, and the past is the present unrolled for understanding” - Ariel Durant, The Lessons of History
As market participants, we are trying to find patterns in the chaos. While "past performance is no guarantee of future results", history can be useful in guiding us through the perplexities of the present. The key is how you frame it.
We use VP Analog to look for comparable historical asset price patterns to help predict future returns. The intuition is that past price movements can be similar to those of the present, but their pace and duration might vary.
Traditional technical analysis techniques can be too rigid in how “similarity” is defined. Price movements need to be lined up in terms of both the shape and the rhythm to enable more actionable takeaways. We achieve this by utilizing Dynamic Time Warping (DTW).
Imagine a vinyl record of classic jazz from the 1950s and a digital track of modern electronic music. At first glance, they seem worlds apart. But upon closer listening, you discern a familiar beat in both songs. Dynamic Time Warping is the tool that lets you stretch and mold the electronic beat to align with the jazz rhythm, revealing their hidden synchrony.

DTW captures elements of both correlation and cointegration, rather than simple correlations. In investing, the market's historical patterns are our classic jazz, while today's market movements are the electronic beats. DTW doesn't predict the future, but it unveils the underlying rhythm, allowing investors to see if today's market is dancing in step with the past.
Analog in Practice
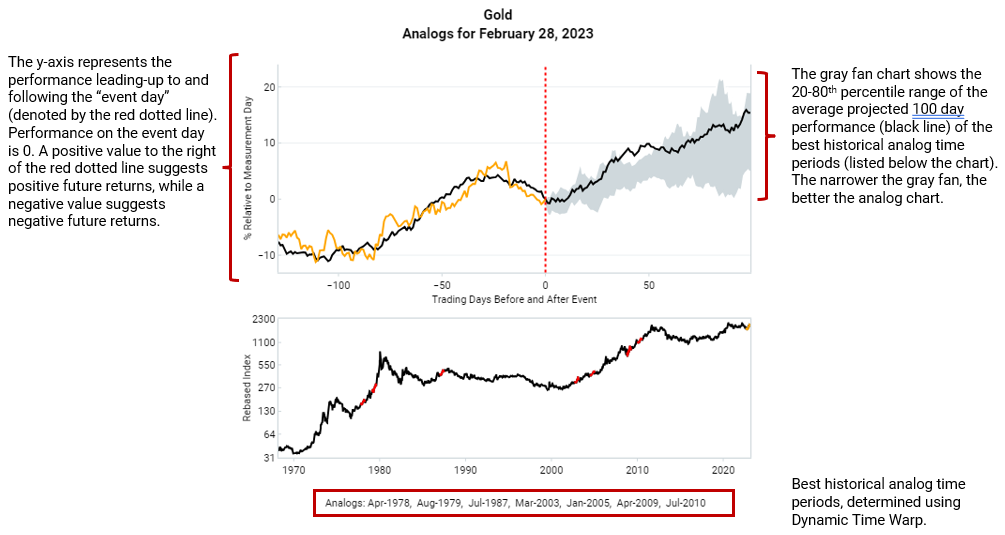
We think of VP analog as a tactical indicator to add conviction to directional views. For example, heading into 2023, our cyclical outlook on gold was positive. Our fundamental gold buy signal had triggered and conditions were in place for a new gold bull market. But after an initial January rally, gold sold off sharply in February. This is where VP Analog came into play (link). It showed us that similar price pullbacks were historically good tactical entry points in the middle of major uptrends.

Each analog uses DTW to identify 4-7 past periods best mirroring recent asset price movements. The dates at the bottom of the chart highlight the dates of the best analog periods.
Assets with longer trading histories yield more effective analogs; limited history means fewer insights into asset behavior across economic scenarios. Historically, an asset may perform poorly in high-inflationary environments and well in low-inflationary ones. But changes in the macro regime - such as large-scale fiscal stimulus - may cause that same asset to have positive returns regardless of the level of inflation. If the past macro environments captured in the analog differ greatly from now, the predictive power of historic price movements diminishes.
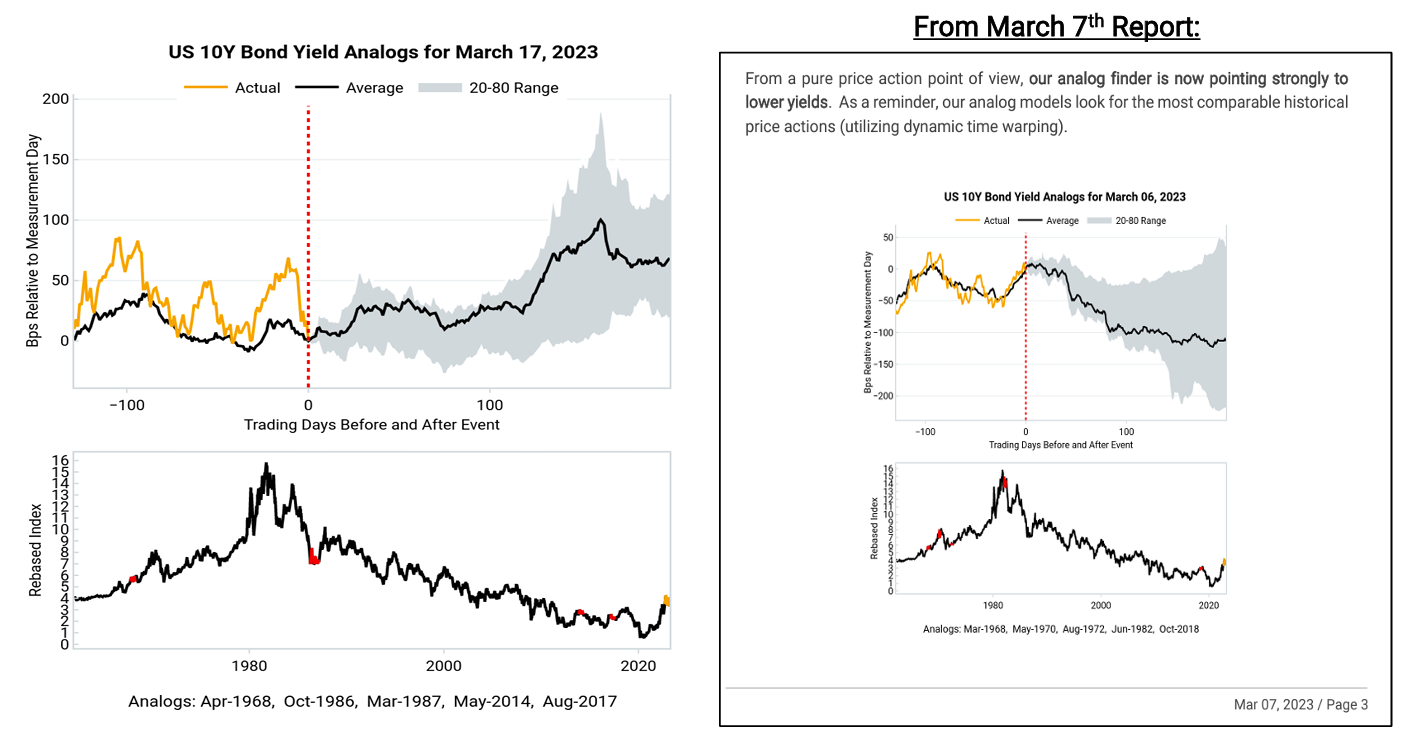
VP Analog can be subject to quick changes. For instance, in March 2023, our analog initially indicated a peak in the 10-year yield, predicting a decline. But two weeks - and one major bank failure later - it shifted, suggesting rising yields. The below screenshot from our March 20th report (link) shows the dramatic shift the projected forward returns in the space of 10 days.

Mean-reversion AND trend-following
VP Analogs flag both trend-continuation and/or mean-reversion patterns, resulting in an indicator with a very low correlation to price and other traditional technical analysis indicators.
Screenshot from VP's Tactical Cookbook 2.0 (link)

Due to this low correlation, it can potentially add extra information and conviction to tactical trading signals.
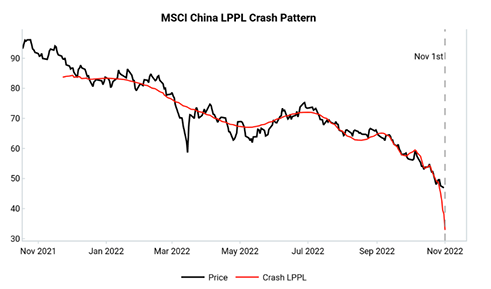
For example, in the autumn of 2022, pessimism toward “uninvestable” China was mounting as the 20th Party Congress loomed. The post-Congress crash was driven by narratives on China's unwavering stance on Zero-Covid and President Xi's policy agenda. We then saw a LPPL crash climax on 1st Nov suggesting peak panic and a contrarian tactical long opportunity (chart from 1st Nov 2022 report below).

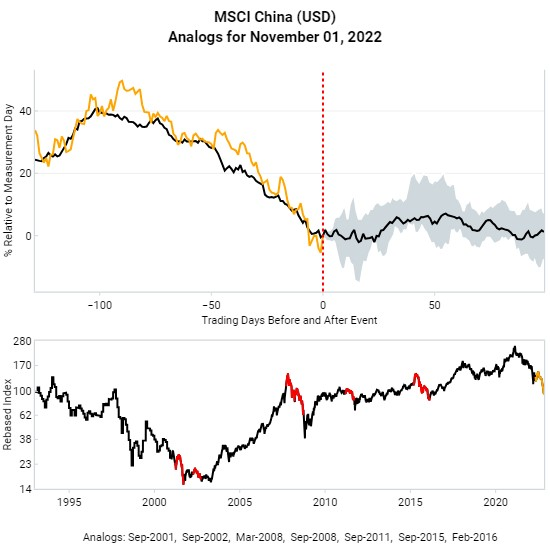
Our analog indicator echoed the LPPL crash climax, finding price action parallels to past market bottoms like the G20 Shanghai meetings in Feb 2016. The analog helped to confirm the crash climax.

In the end, Chinese equities managed to rally ~60% off the lows over the next 3 months. However, because tactical tools are developed for the 1-3 month timeframe, we relied on our other cyclical tools such as China leading indicators to inform our cautious 6-12 month outlook at the time.