GBPAUD Mean-Reversion Lower, Tactical Aligns to Cyclical
- Tactical (1-3m+ outlook) and cyclical (6-12m+ outlook) indicators are aligning to bet on lower GBPAUD
- Our LPPL (Log Periodic Power Law) models are flagging the end of the current LPPL bubble, which is further corroborated by VP Analog and VP Fast Money.
- Cyclically, the policy divergence between the UK and Australia is extreme. Historically, it has usually paid to bet on mean-reversion of extreme policy divergences.
- Structurally (2-3y+ outlook), the key data is more mixed. The UK remains capital-scarce relative to Australia (supporting GBP), but the UK runs a significant current account deficit (a persistent GBP vulnerability).
Tactical indicators align for GBPAUD fall to persist
We are seeing tactical sell signals in GBPAUD with our LPPL (Log Periodic Power Law) models flagging the end of the current LPPL bubble.
Our tactical analog finder further corroborates this. We use dynamic time warp to find the best historical price analogs for the trailing 6-month period. We aggregate these historic price analogs to project forward short-term expected returns over the next 100 trading days. Historically comparable price action to what we have experienced in the past six months for GBPAUD has been mostly associated with previous tradeable tops.
Our speculative flow proxy, VP Fast Money, also shows very extreme previous levels of speculative buying, which could be vulnerable to a reversal lower.
This broad alignment of bearish tactical indicators fits well with the cyclical picture.
Cyclically, it usually pays to fade extremes in relative policy stances
One of our foundational FX frameworks was popularized by Soros and Druckenmiller, who used relative fiscal vs monetary policy stances to guide the cyclical outlook and bet big on FX moves (e.g. long USD into 1985 Plaza Accord, long Deutschemark after fall of Berlin Wall in 1989).
In our interpretation, the key insight was that tight monetary policy + loose fiscal policy tends to attract capital inflows to finance an expanding trade deficit due to rising demand (from fiscal easing) and higher rates (from tight monetary policy). There is academic support for the thesis (Mundell-Fleming model). In theory, this framework works better for small open economies with freely floating exchange rates.
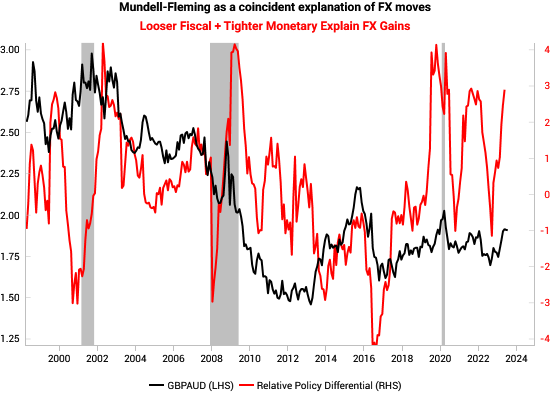
The chart below shows the UK's current policy mix is showing very loose fiscal and tight monetary policy relative to Australia, which has been a coincident explanation of the strong GBPAUD rally YTD and indeed the LPPL bubble. However, this policy divergence is looking very extreme now on a trailing basis.

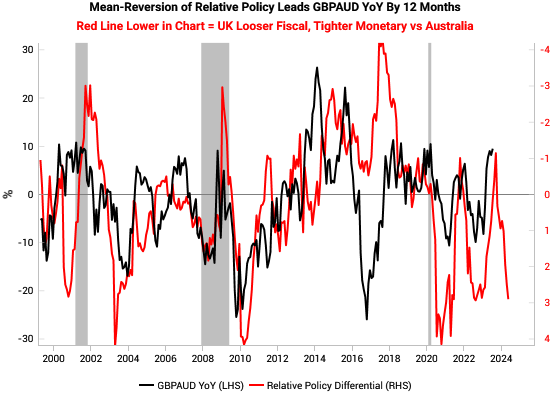
We previously used this Mundell-Fleming framework to make the contrarian case to buy GBP and EUR in September 2022 (link). Today, we have updated that work by converting relative policy differentials into 5-year Z-scores, which helps to flag extremes in policy divergence that could be set to mean-revert. When we reverse and push forward the relative policy differential indicator, it has a remarkably good 12 month lead on future GBPAUD moves.

Our working thesis for why this mean-reversion works is that within DM, extreme divergences in policy typically cannot persist for too long before international policy coordination (e.g. Plaza Accord, Shanghai Accord) or market pressures cause a reversal of the policy stance.
Reviewing leading indicators for the UK and Australia: UK inflation leading indicators are continuing to drop even as Australia's is rebounding slightly. The UK's growth leading indicators are also at much lower levels vs Australia's, suggesting the UK may already be in recession. Again this supports weaker GBP vs AUD.
The above leading indicators are divergent with current growth and inflation surprises. The below chart shows that GBP remains an outlier in the top right “hawkish surprise” quadrant, indicating that on a trailing basis, both UK inflation and growth have been surprising to the upside. However, given the much more negative message from our UK leading indicators, GBP is vulnerable to negative surprises. In contrast, the AUD is in the “dovish surprise” quadrant indicating that trailing data has been weaker than expected. Again this is divergent with Australia's growth and inflation leading indicators which look in better shape than the UK. Again, this suggests there is scope for upside surprises for the AUD.
Inflation remains above target for the BoE and RBA (left chart below) but is trending in the right direction. Australia's yield curve (2s10s) has also un-inverted, in contrast to the deeply inverted UK curve. This suggests the fixed income markets are becoming more comfortable with Australia's outlook and policy stance relative to the UK, which should again support the AUD.
Cyclically, the outlook is good to bet on GBPAUD to mean-revert lower.
Structurally, the UK remains capital-scarce, clouding the long-term picture
In the long run, we have a few simple structural frameworks to provide context for FX: REER deviation, persistent current account deficits, and the capital cycle applied to FX.
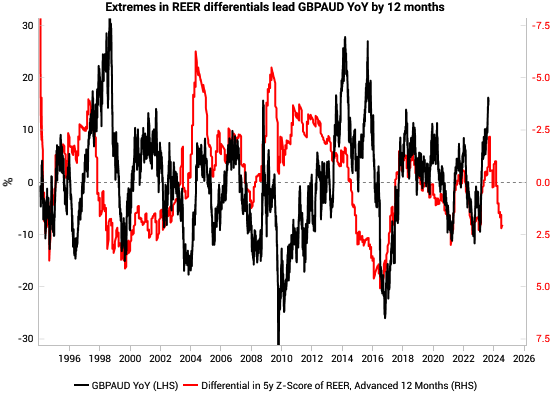
One of the simplest long-term guides to FX is the deviation in REER from 5y and 10y averages. FX tends to be an adjustment mechanism for economic imbalances, so one should expect some mean reversion over time. The below chart shows that the 5y REER Z-Score has had a good 12-month lead over the past few years and currently points to a lower GBPAUD.

Another simple yet effective FX tail risk indicator is persistent and deteriorating current account deficits. Our crisis framework was laid out in our June 2022 report, The Agony and the Ecstasy: VP’s crisis framework. Currently, the UK remains in the 10 worst economies in terms of external stress risk (see chart below). In contrast, Australia runs a current account surplus.
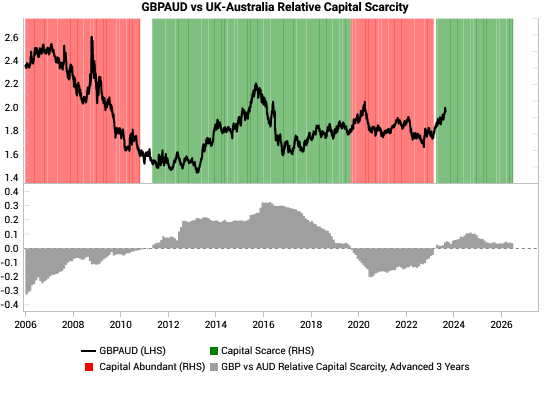
Finally, we leverage our capital cycle scores (link) to offer a long-term guide to FX trends. Currently, the UK is flagged as being capital-scarce relative to Australia, which suggests there should be structural flow tailwinds for the GBP relative to the AUD on a 2-3y+ forward basis.

In summary, we see a mixed structural picture, where the capital cycle supports a stronger GBP, but offset by the risk of persistent current account deficits and overvaluation. This mixed picture does not contradict a short GBPAUD.