ECB Policy Mistake - VP ECB Easing Regime Active
- VP's ECB easing regime model has now triggered, yet Christine Lagarde continued to sound very hawkish this week. This suggests the ECB is set to make a policy mistake and could be forced to unwind its hikes in short order, once a eurozone recession becomes more obvious.
- EUR 2s10s 1y forward has inverted again, lowering the ATM strike for yield curve caps. This creates an attractive entry point for steepeners. A 1y EUR 2s10s yield curve cap with strike at -20bps only costs 10bps upfront (priced using Bloomberg SWPM).
We use a combination of economic and market inputs to quantify the probability of ECB policy pivots. This works well to help time trend turns in outright rates and curve positions (link). Our model now suggests the ECB should be cutting, rather than hiking, given the underlying growth and inflation outlook.
The growth outlook remains very bad. Our eurozone recession model (Lasso regime) remains active (top left chart below), with hard data stress now visible in German manufacturing new orders (bottom left chart below). The EuroCoin activity indicator is also negative again (similar to GDPNow, top right chart below) and real M1 growth continues to plunge (bottom right chart below).
Our cyclical eurozone LEI also continues to make new lows (top left chart below). Sweden, as a smaller and more open economy, tends to lead eurozone activity and Swedish new orders to inventory ratios remain weak (top right chart below). The lagged impacts of previous interest rate rises have likely not fully fed through yet (bottom left chart below) and German inventory assessments are surging again (bottom right below).
Eurozone inflation still remains high. However, on a forward looking basis, the worst is likely already over. On a backward looking basis, the hawkish focus comes from the ECB supercore CPI which remains very high (left chart below) and on surging nominal wage growth (right chart below).
However, our main eurozone inflation LEI is finally starting to roll over meaningfully (top left chart below) while our measure of eurozone inflation expectations (top right chart below) also shows a clear peak in inflation expectations. Business price surveys also show inflationary pressures are weakening (bottom two charts below).
Food and Bev has been a big driver of inflation, with a large basket weight and currently running at 13%+ YoY (right chart below). Food manufacturing PPI suggests this will roll over further from here (left chart below).
Eurozone inflation and growth surprises have put it into the “stagflation surprise” quadrant among G10 (left chart below). Given the more benign outlook from eurozone inflation leading indicators, it makes sense to fade the stagflation narrative and focus on the growth risk.
EUR 2s10s 1y forward has inverted again, lowering the ATM strike for yield curve caps. This creates an attractive entry point for steepeners. A 1y EUR 2s10s yield curve cap with strike at -20bps only costs 10bps upfront (priced using Bloomberg SWPM). This offers very asymmetric risk-reward in our view. Steepeners outright is also attractive, but obviously less asymmetric given uncapped downside.
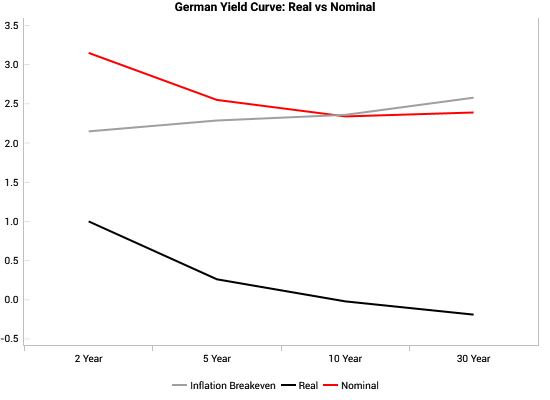
One concern for this trade is that our fair value model for neutral real rates in the eurozone (left chart below) is hovering around 1.50-1.75% range, which is still higher than the real rate priced into the curve (right chart below). However, the fair value model is based on backward looking data, so we would want to see the neutral rate estimate also come back down as the eurozone inflation data improves.
 |