Understanding Crowding
- Crowded stocks benefit less from good news and are hurt more by bad news than their uncrowded counterparts.
- VP's Crowding Score uses unique and uncorrelated inputs to capture a range of investor behaviors, and flag when a stock is most/least at risk from herd mentality.
- Further backtests added 4th March 2024
Crowding for Single Stocks
We have developed an indicator ("VP Crowding Score") to gauge the popularity of a stock relative to its peers. The score includes a variety of unique and uncorrelated inputs, which together reflect the behavior and sentiments of a range of investors. As part of our wider equity framework, our crowding score flags tactical extremes across stocks with the capital cycle acting as a slower-moving structural anchor. Clients can use capital cycle and crowding to rank companies on our Stock Idea Generator.
Quantifying crowding is important because it provides a check for herd mentality. When everybody and their mother is piling into a particular stock, the prevailing narrative surrounding that company will likely be overwhelmingly positive. We observe that crowded names benefit less from good news and are hurt more by bad news than their uncrowded counterparts.
How Do We Measure Success?
We developed 3 key metrics to quantify how much a stock benefits or is hurt by market activity.
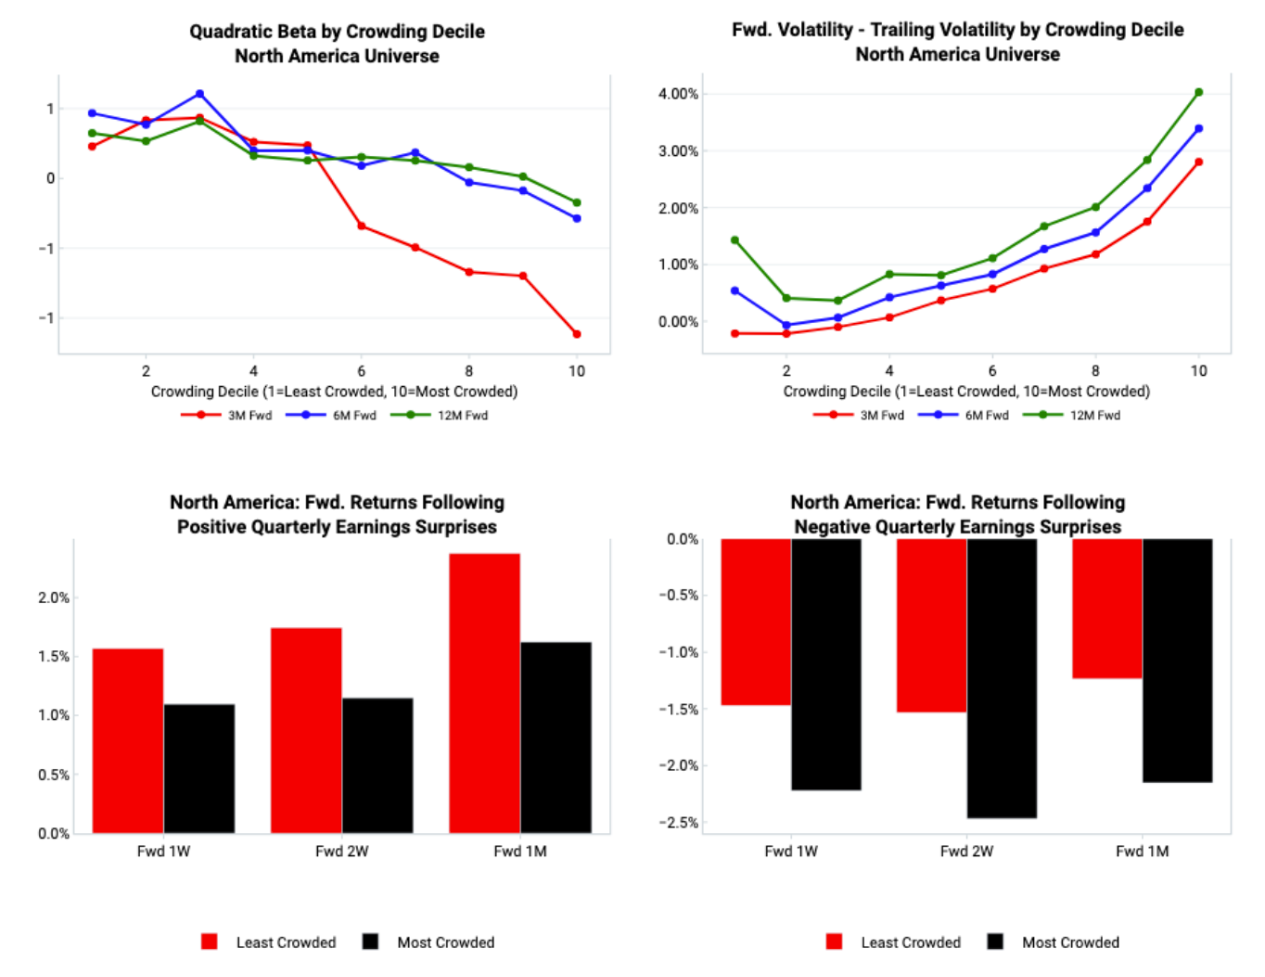
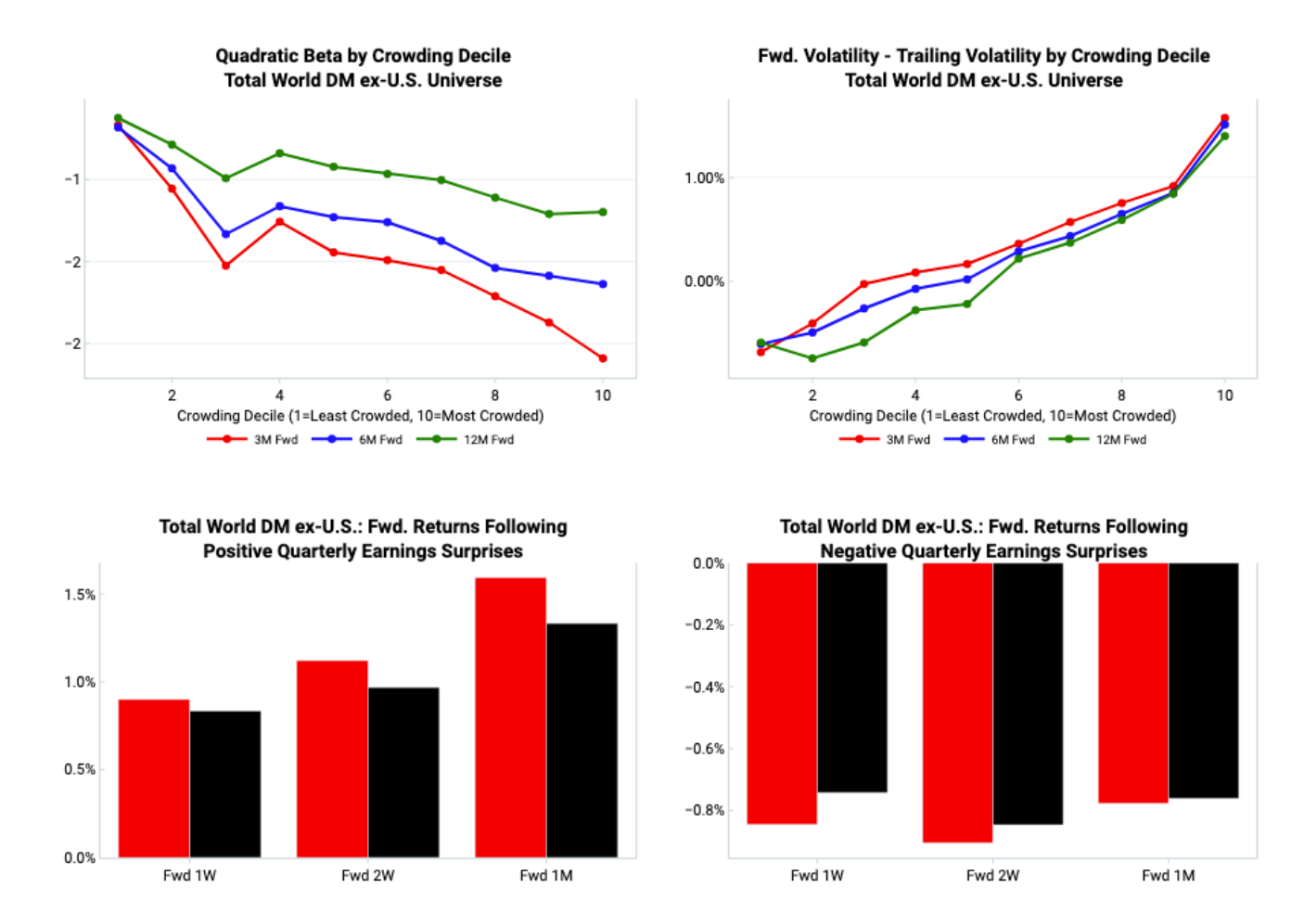
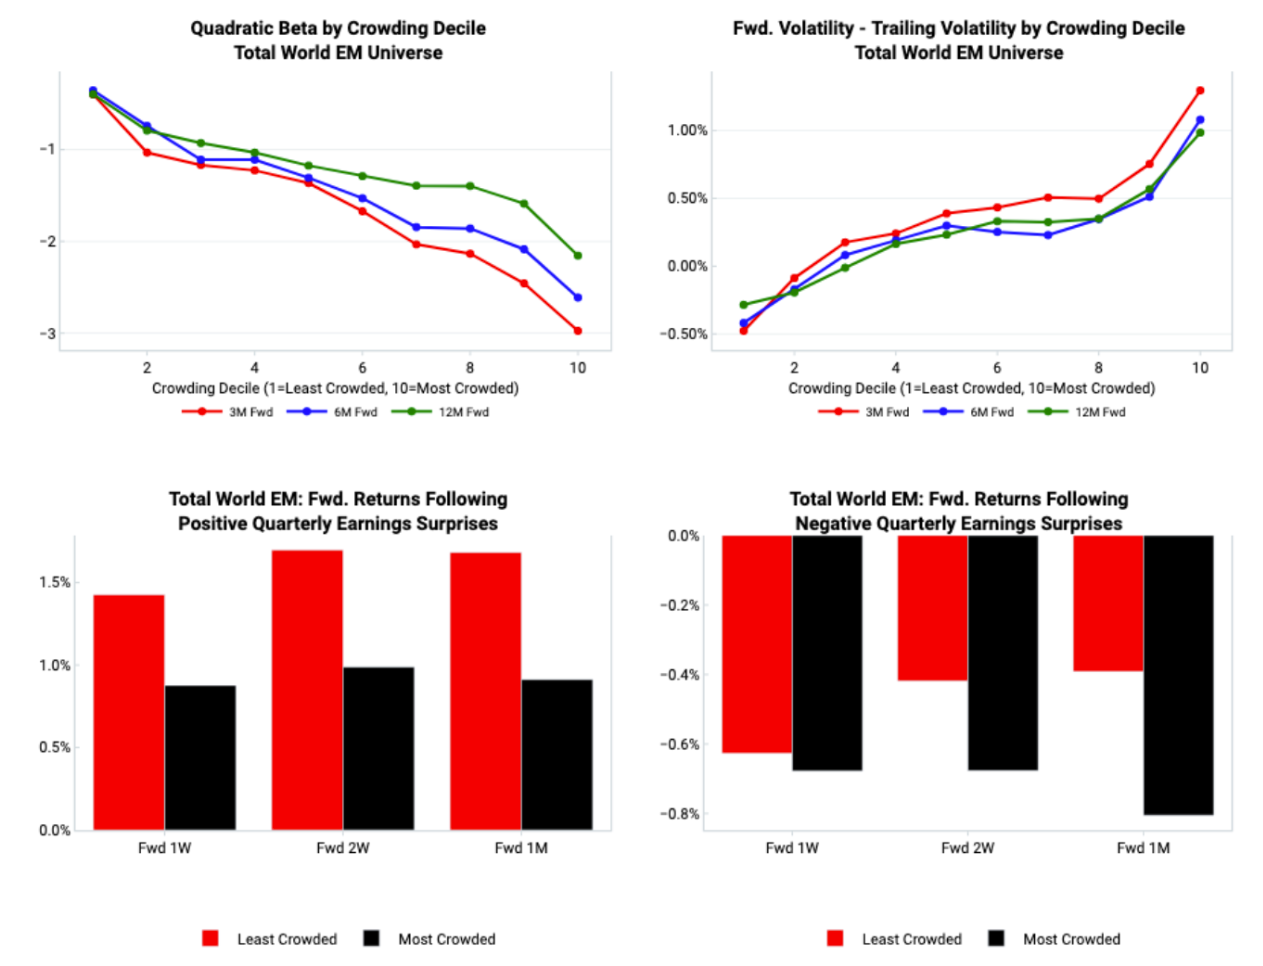
First, we implemented a factor known as quadratic beta. Unlike plain old beta (which is a linear regression between a stock’s returns and the returns of the overall market), quadratic beta fits a quadratic model to these data points. Then, your quadratic beta “factor” is simply the coefficient of the squared term in the resulting quadratic model. The idea behind this factor is that most times its value is fairly insignificant. But, when the market is volatile, the sign of quadratic beta indicates how a company reacts to a bumpy market. A positive quadratic beta indicates resilience (parabola opening upwards and thus at extremes of market returns the stock experiences higher returns), while a negative quadratic beta indicates a company struggling with a choppy market. Uncrowded stocks should have a higher quadratic beta value than crowded stocks.
Second, we measured the difference between a stock’s forward downside volatility over X months and its trailing downside volatility over the past X months. This value, the stock’s vol difference, encapsulates the extent to which a stock benefits from good news and is hurt by bad news. Crowded stocks should experience a large, positive vol difference (i.e. forward downside vol larger than trailing downside vol) because crowded names respond less positively to good news and more negatively to bad news.
Lastly, we noted that a stock’s price action following its quarterly earnings call is a great example of how a stock responds to both good and bad news. Crowded names should have less positive forward returns than uncrowded names in the aftermath of a positive earnings surprise. And, on the flip side, crowded names should have larger negative returns than uncrowded names in the aftermath of an earnings miss.
These three metrics form the objective function that we use to measure the success of the VP Crowding Score.
Inputs
Before we tested anything we wanted our crowding score to capture the diverse range of market participant behavior (active fund managers, speculators, sell-side analysts, etc.). We started off with a set of about 15 different inputs which we systematically tested both individually and in unique combinations using the objective functions detailed in the previous section. Following this testing, we were left with a set of five, uncorrelated inputs which make up our crowding score:
- VP Fast Money: A flow-based measure that isolates speculative behavior in markets from the actions of “patient money”
- EPS Estimate Momentum: 2yr growth in the consensus forward EPS estimates for a company
- Buy Recommendation Percentage: The percentage of total analyst recommendations for a company that are “Buy” or equivalent
- Active Fund Sector OW/UW: How overweight or underweight actively managed funds are in GICS L2 sectors compared to their benchmarks
- YoY Growth in Active Fund Top 20 Positions: One year growth in the number of actively managed funds that have a company in their top 20 holdings
Universes
The VP Crowding Score is calculated across three distinct universes to ensure accuracy and comparability across all stocks in each universe.
- United States: Russell 3000 universe (~3k names currently, 7.6k companies over all history)
- Developed Markets ex-U.S.: Companies from developed countries (excluding the U.S.) in the Vanguard Total World universe (~4.1k names currently, 6k companies over all history)
- Emerging Markets: Companies from all remaining countries in the Vanguard Total World universe (~2.5k names currently, 4.1k companies over all history)
- Total Coverage: 9.6k names currently, 17.7k names over all history
Performance
United States:
Developed Markets ex-U.S.:
Emerging Markets:
Notes on above backtests:
- The top decile of names according to KMV score are removed from consideration in these graphics.
- Quadratic beta for each company is sampled monthly and uses the index for the country in which the company resides as the market returns in this factor’s calculation.
- For DM and EM earnings surprises and misses, we do the following:
- Remove countries that have less than 50 companies in the universe
- For the remaining countries, re-decile all companies within the country they come from according to their crowding score
- Determine the average forward performance for each crowding decile within each country
- Aggregate these values up to the universe level, weighting the average forward performance of each country’s crowding deciles by the number of companies each country contributes to the overall universe
Next steps
We plan to add to this Understanding report with more case studies and further backtests using Crowding as a long/short factor strategy (i.e. long the least crowded names vs short the most crowded names). And we are combining crowding with other key VP tools, e.g. capital cycle, as part of our wider equity framework.
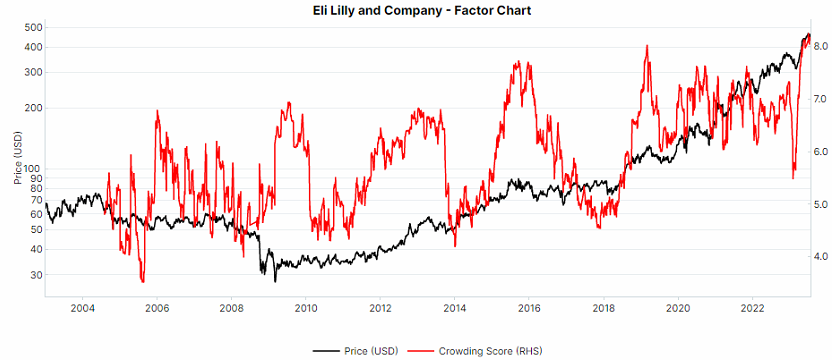
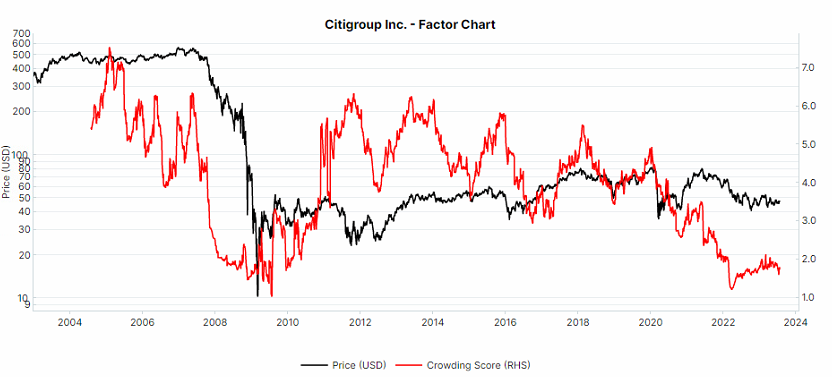
The above testing gives us conviction that the VP Crowding Score can be used as a key tactical input for our Stock Idea Generator tool. Within the tool we show the full history of a stock's crowding score to give clients a feel for how today's ranking compares to history (e.g. Eli Lilly - one of the most crowded in S&P, Citigroup - one of the least crowded).
Further backtests
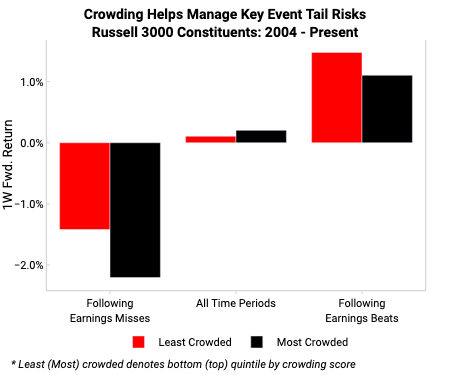
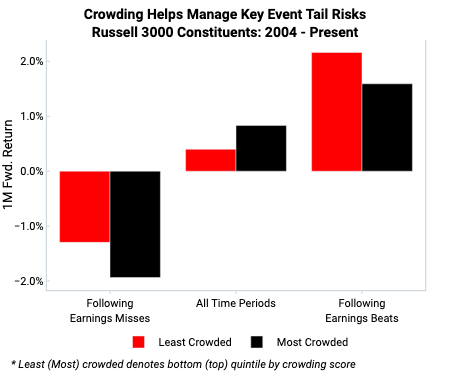
Crowded stocks tend to benefit less from good news catalysts and suffer more from bad news catalysts. This corroborates the above results showing that more crowded stocks display more negatively skewed forward performance.
In the below charts, we see that the most crowded stocks (defined as top quintile by crowding score) underperform the least crowded names (bottom quintile by crowding score) in response to BOTH earnings misses and earnings beats.
On an unconditional basis, the least crowded stocks underperform slightly (middle bars in charts), which is good news as it shows that on average institutional investors do pick better stocks. However, this relationship reverses around event risks, where in response to both earnings beats and earnings misses, the least crowded names are more resilient and the most crowded names tend to underperform (left and right bars in chart).
 |  |